Data analysis is one of the most in demand skills in 2025 and becoming a data analyst is more achievable than ever. Developing strong data analyst skills is crucial to meet the surging demand in the job market.
by Mihir Kamdar / Last Updated:

After reading this guide, you’ll be equipped with the knowledge to:
To follow the data analyst calendar, please click on the download link for the file.
Data analysts are the ones who interpret the data and turn it into actionable insights for businesses. With the data explosion every day—from customer transactions to social media interactions—companies across all industries are looking for data analysts to help them make informed decisions. Individuals in various industries require data analytics skills for effective digital strategies.
The job involves:
It is important to learn how to perform data analysis effectively, including programming in R or Python, SQL, and presenting analytical findings.
The demand for data analysts is not limited to tech companies. Industries like healthcare, finance, retail and even sports are using data analytics to improve their operations, so now is the time to get in.
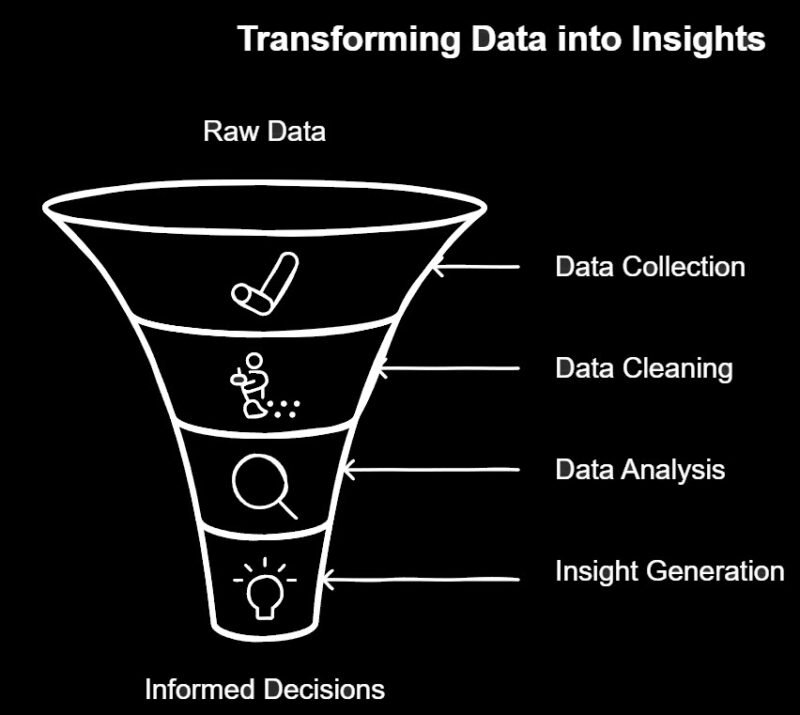
Data analysis is the process of extracting insights and meaningful information from raw data. It involves using various techniques, tools, and methods to analyze and interpret data, identifying patterns, trends, and correlations. In today’s data-driven world, data analysis is a crucial step in the decision-making process. It helps organizations make informed decisions by providing accurate and reliable data-driven insights. Whether it’s understanding customer behavior, optimizing operations, or predicting future trends, data analysis empowers businesses to turn data into actionable strategies.
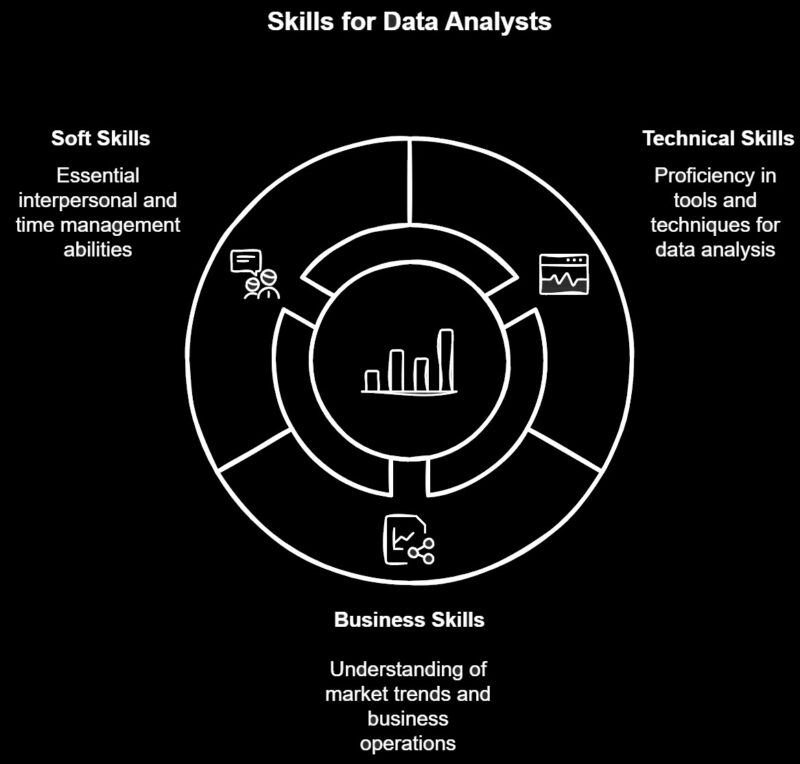
To become a successful data analyst, you need a blend of technical, business, and soft skills. Here are some key skills required for a data analyst:
Technical Skills: Proficiency in data analysis tools like Excel, SQL, and Python is essential. Familiarity with data visualization tools such as Power BI and Tableau helps in presenting data insights effectively. Additionally, understanding statistical analysis and exploratory data analysis techniques is crucial for interpreting data accurately.
Business Skills: A good data analyst understands business operations, market trends, and industry dynamics. This knowledge helps in contextualizing data insights and making them relevant to business goals.
Soft Skills: Communication is key when presenting data findings to stakeholders. Problem-solving skills enable you to tackle data challenges effectively. Collaboration is important as data analysts often work in teams. Time management ensures you can handle multiple data analysis projects efficiently.
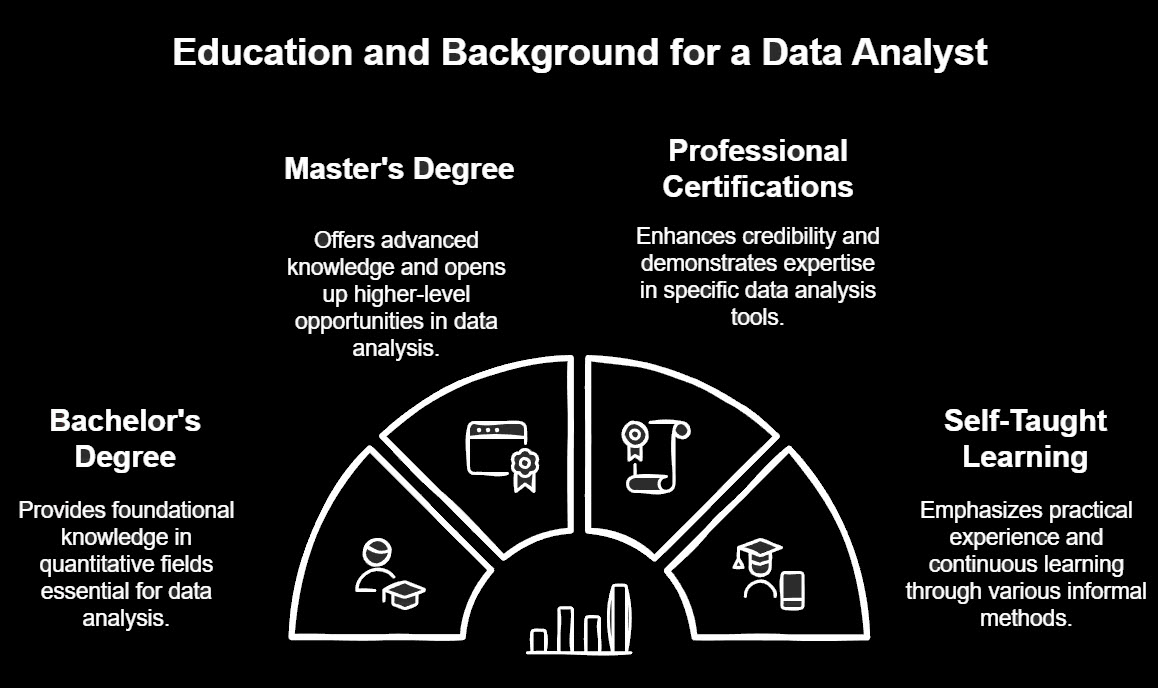
While a degree is not always mandatory to become a data analyst, having a strong educational background in a quantitative field can be highly beneficial. Here are some common education requirements for a data analyst:
Bachelor’s Degree: Degrees in mathematics, statistics, computer science, or related fields provide a solid foundation in data analysis.
Master’s Degree: Advanced degrees in data science, business analytics, or related fields can deepen your knowledge and open up more advanced opportunities.
Professional Certifications: Certifications in data analysis, data science, or related fields, such as Microsoft’s Data Analyst Associate or Google’s Data Analytics Professional Certificate, can boost your credibility and demonstrate your expertise.
It’s worth noting that many data analysts are self-taught, having learned through online courses, boot camps, and personal projects. While formal education provides a strong foundation in statistical analysis, data visualization, and data science, practical experience and continuous learning are equally important in this ever-evolving field.
Why Excel Matters in Data Analysis
Microsoft Excel is more than just a spreadsheet application; it’s a powerful tool for data analysis that is widely used in the business world because:
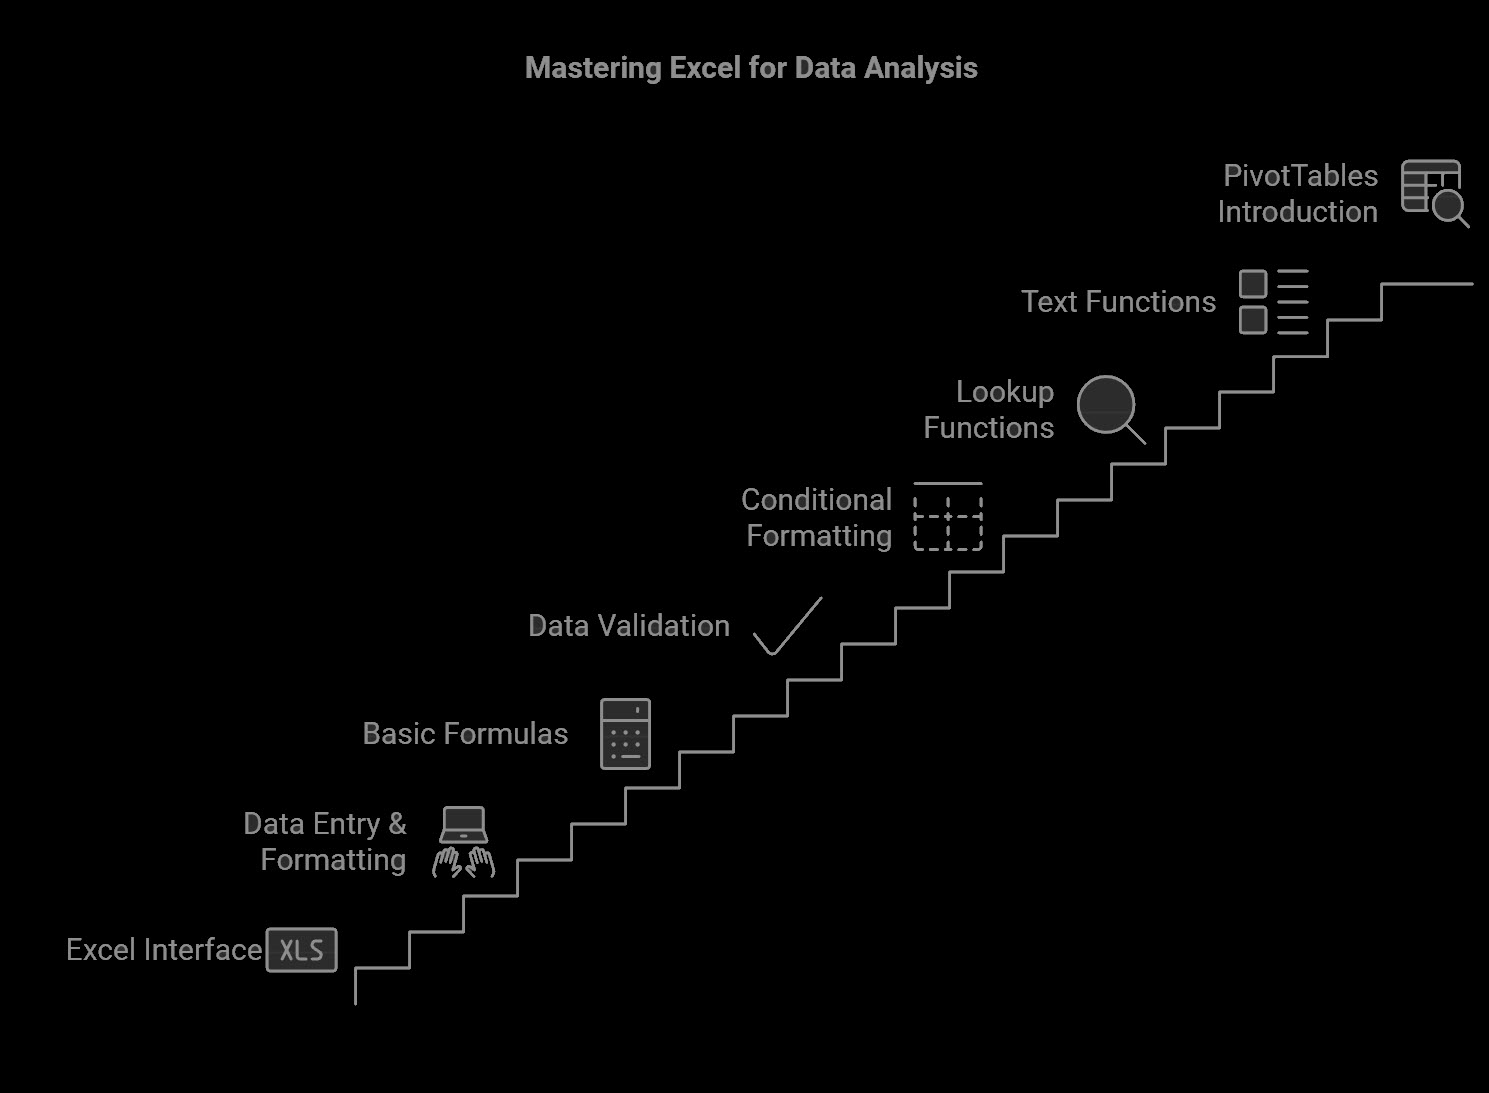
Week 1: Excel Basics
Days 1-3: Basic Operations, Data Formatting and Handling
Days 4-7: Essential Functions and Tools
Real Business Example:
You are tasked to consolidate daily sales reports from multiple retail stores. Each store provides data in different format. Using Excel, you can standardize the data, merge it into one dataset and perform initial analysis to identify overall sales trends.
Week 2: Advanced Excel
Days 8-10: Connecting Data and Advanced Analysis
Days 11-14: Power Tools for Data Handling
Real Business Example:
You are tasked to generate a monthly financial report that consolidates data from different departments. By using PivotTables and Power Query, you can automate data extraction and transformation and reduce the time spent on manual data manipulation.

Why SQL Is Important
Structured Query Language (SQL) is the standard language to manage and manipulate relational databases. It’s important because:
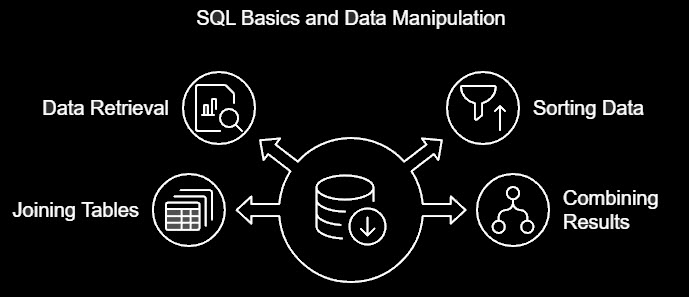
Week 3: SQL Basics
Days 15-17: Basic Data Retrieval and Querying
Days 18-21: Joining Tables and Combining Data
Real Business Example:
You need to generate a report to identify top performing products. By joining sales and product tables, you can aggregate sales data and rank products based on revenue generated.
Week 4: Advanced SQL
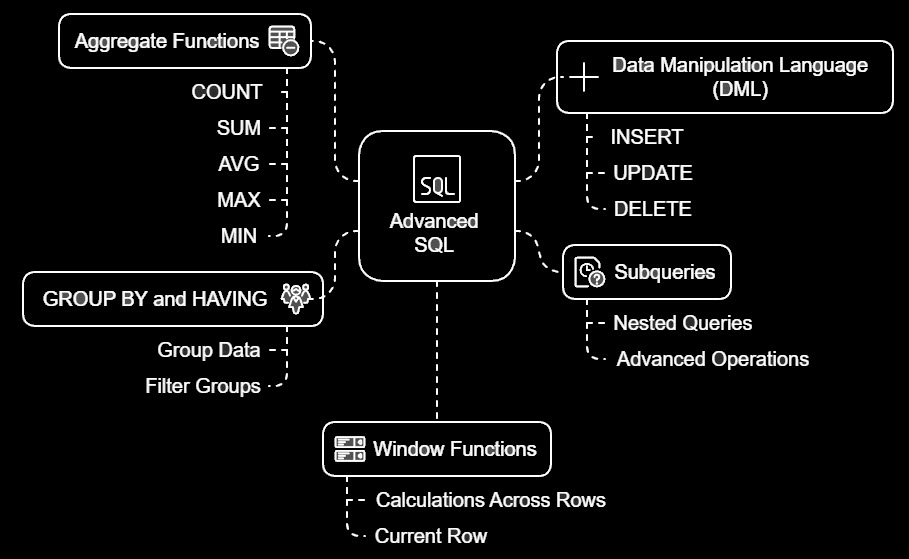
Days 22-28: Complex Queries, Subqueries and Data Manipulation
Real Business Example:
You are analyzing customer churn rates. By writing complex queries that involves multiple tables and conditions, you can identify patterns and factors that cause customer attrition and help the company to develop retention strategies.
Why Data Visualization Is Important
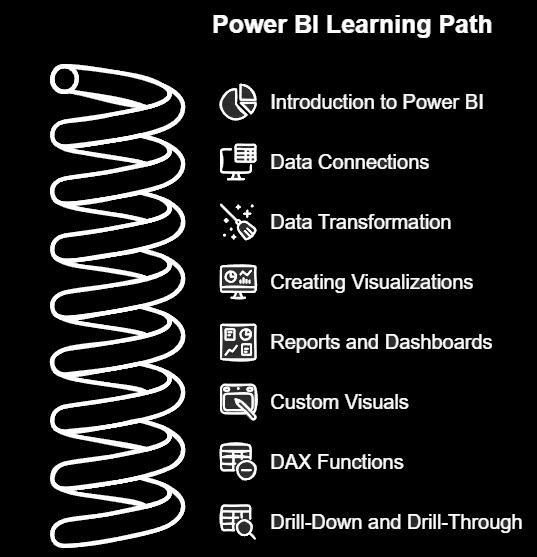
Week 5: Power BI
Days 29-31: Power BI Basics
Days 32-35: Power BI Advanced Features
Real Business Example:
Create a dynamic sales dashboard that shows real-time data on regional performance, product trends and sales targets. This dashboard can be shared with sales teams and management to monitor progress and make decisions.
Week 6: Tableau
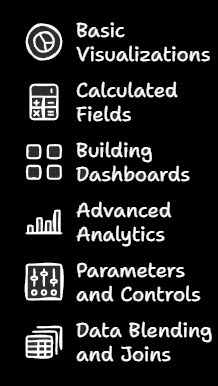
Days 36-38: Tableau Basics
Days 39-42: Tableau Advanced Techniques
Real Business Example:
Create a customer analysis dashboard that shows buying patterns, demographic insights and retention metrics. This can help marketing team to tailor campaigns and improve customer engagement.
Why Python Is Important for Data Analysts
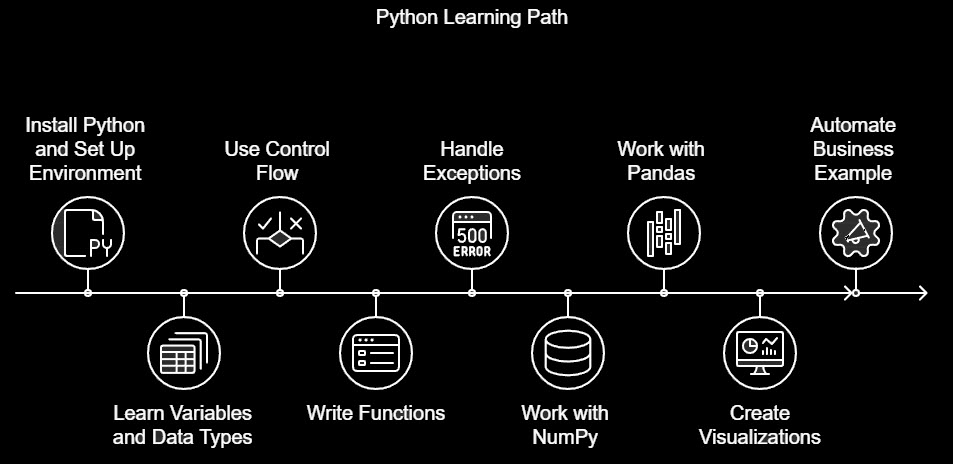
Week 7: Python Basics
Days 43-45: Syntax, Data Types and Control Structures
Days 46-49: Data Analysis Libraries
Real Business Example:
Automate the consolidation of weekly sales reports from multiple sources by writing a Python script that reads data files, cleans them and combines into one report.
Week 8: Advanced Data Analysis
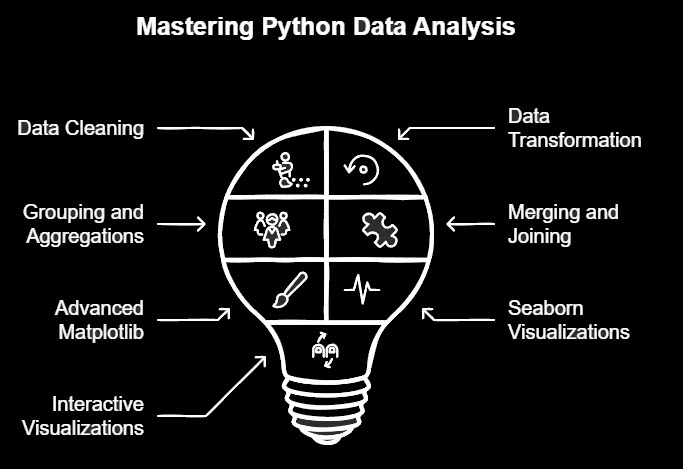
Days 50-53: Advanced Pandas
Days 54-56: Visualization
Real Business Example:
Analyze customer feedback data from multiple channels to track sentiment over time. Use visualizations to present findings to customer service team for actionable changes.
Week 9: Automation and Integration
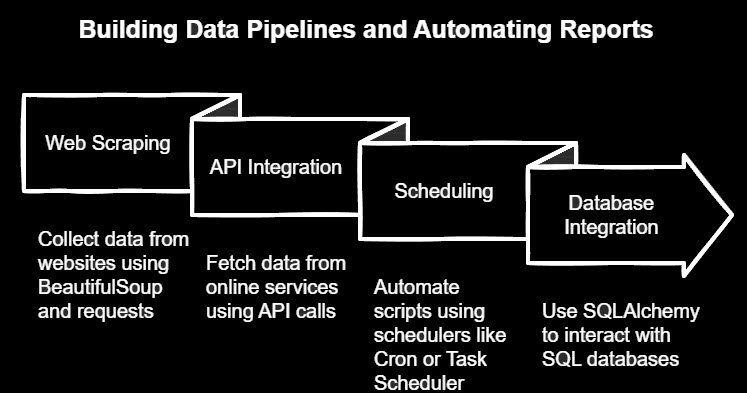
Days 57-63: Building Data Pipelines and Automating Reports
Real Business Example:
Build a system that automatically fetches daily stock prices, updates financial models and sends summary reports to stakeholders via email.
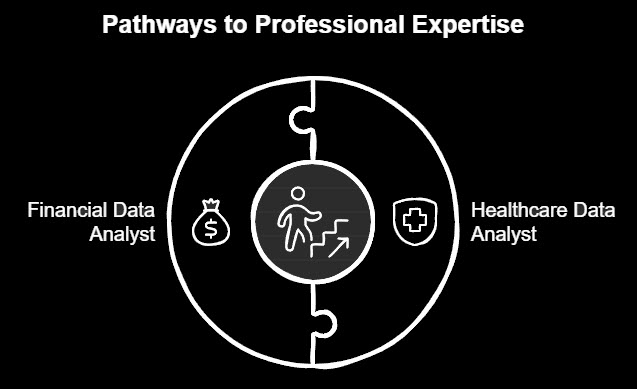
How to Become a Healthcare Data Analyst
Learn:
Apply: Analyze patient data to find trends in healthcare outcomes, optimize hospital operations and contribute to better patient care.
How to Become a Financial Data Analyst
Learn:
Apply: Build models to predict market trends, assess investment opportunities and develop tools for financial planning and analysis.
Days 64-70: Build Projects
Days 71-77: Document Your Work
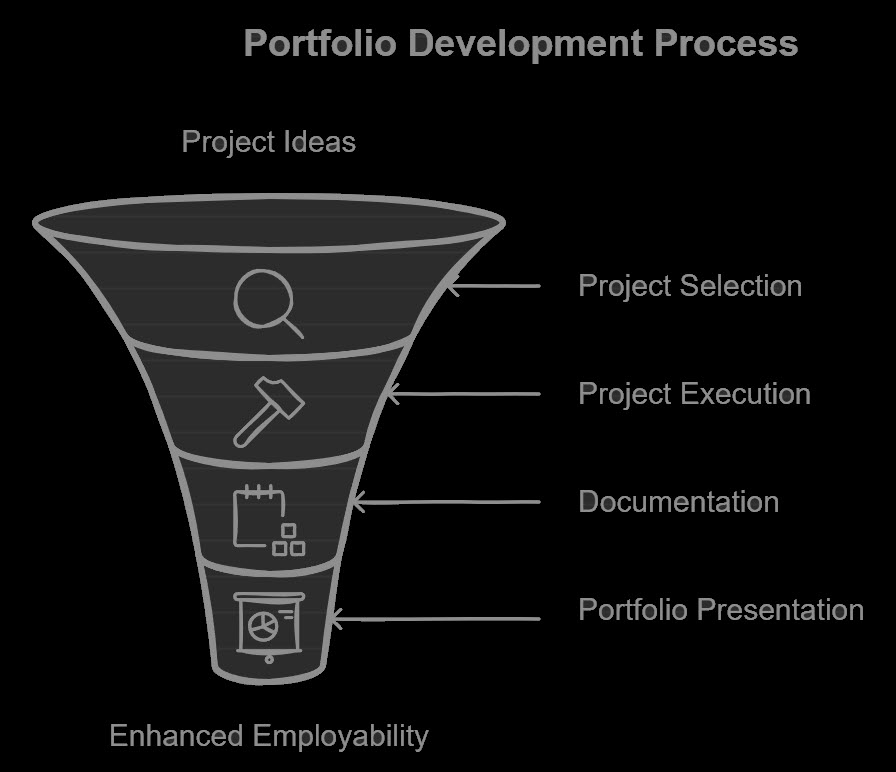
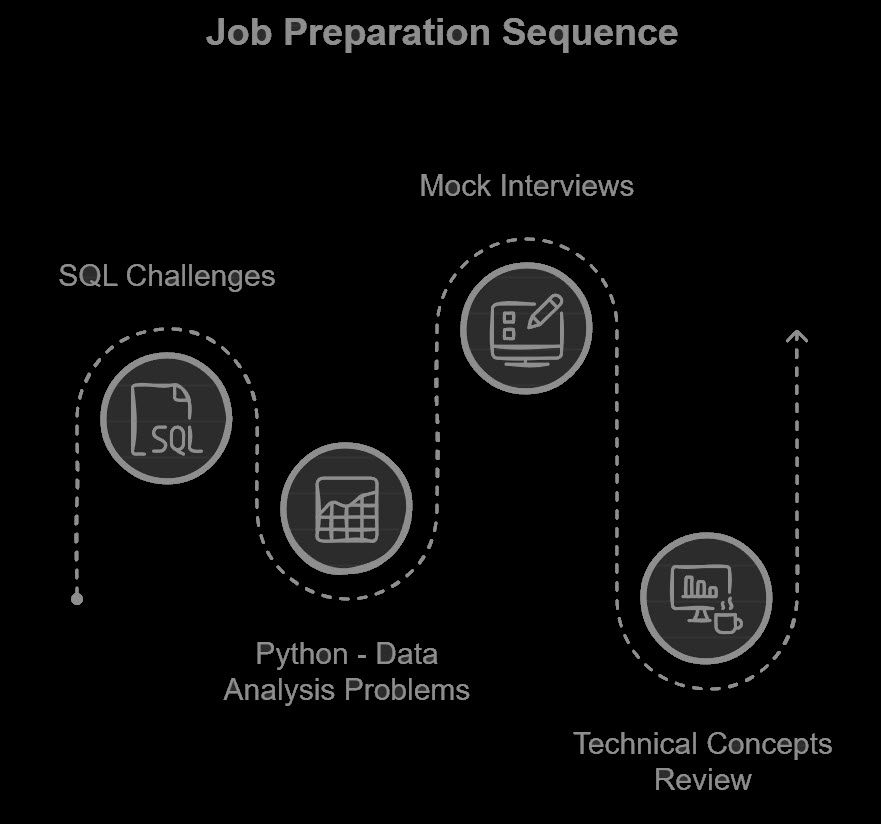
Week 12: Interview Preparation
Practice:
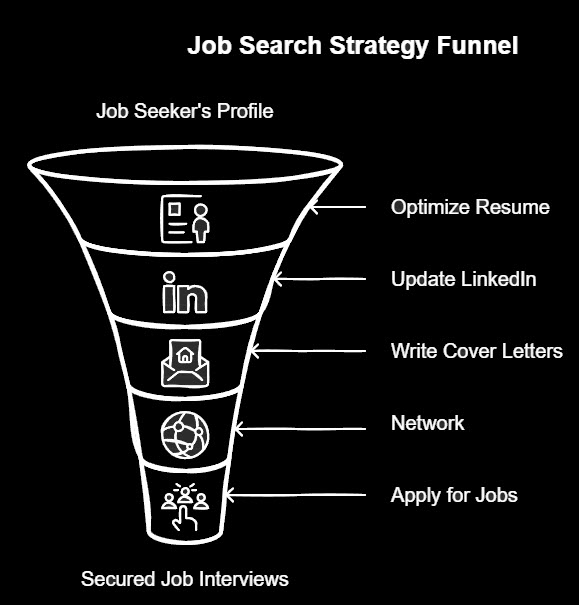
Week 13: Job Search Strategy
Optimize:
Network:
Apply:
For Beginner Data Professionals
For Career Switchers Data Professionals
3 Months: Fast Track
6 Months: Part Time
You can become a data analyst in 2025, regardless of your background. Follow this step by step guide, put in the time to learn and build a solid portfolio and you’ll be ready for this in-demand role.
