Discover how your brain’s creative and analytical strengths influence your choice of data analytics tools and storytelling techniques for impactful insights.
by Mihir Kamdar / Last Updated:
After reading this guide, you’ll be equipped with the knowledge to:
In today’s data-driven landscape, businesses and professionals need to make sense of complex data to derive actionable insights. Whether you’re working with data analytics tools, analyzing data, or communicating findings through storytelling, your approach should align with your cognitive strengths—whether analytical or creative.
In this post, I’ll show you how to choose the best data analytics tools, techniques, and strategies, while also integrating the power of data storytelling to create compelling narratives. This comprehensive guide will cover the best tools for analysis, popular visualization techniques, and how to connect analytical methods with storytelling for maximum impact.
Understanding brain dominance is crucial in data storytelling as it helps to create a narrative that resonates with the audience. Research suggests that the human brain is wired to respond to stories, and data storytelling leverages this phenomenon to communicate insights effectively. Data storytellers can create a compelling narrative that engages the audience and inspires action by understanding how the brain processes information.
Data storytellers can use this knowledge to create a narrative that resonates with the audience. By using visualizations, characters, setting, conflict, and resolution, data storytellers can create a story that engages the audience and communicates insights effectively
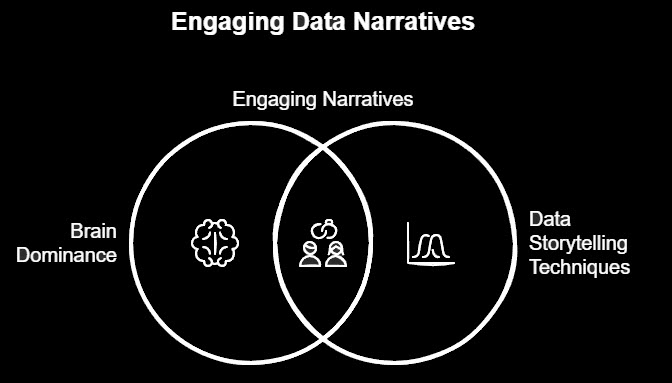
A fascinating way to understand your data analytics style is by identifying your brain’s dominant hemisphere. The video “Are You Creative or Analytical? Find Out in 5 Seconds” explains this concept through a simple hand-clasping test:
Clasp your hands together naturally.
Observe which thumb rests on top:
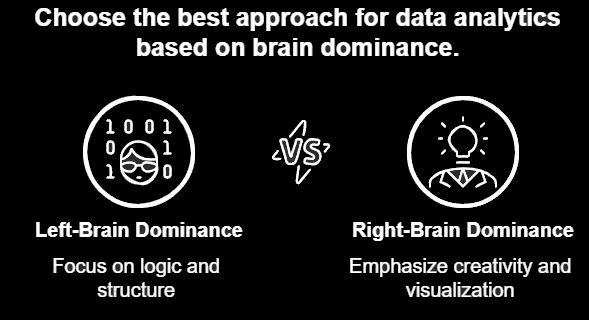
Right Thumb on Top: You’re likely left-brain dominant, excelling in logic, analysis, and structure—ideal for tools like SQL, Python, and Excel.
Left Thumb on Top: You’re likely right-brain dominant, thriving in creativity, storytelling, and visualization—perfect for tools like Tableau and Power BI.
The left hemisphere is associated with structured, logical analysis and handling big data analytics tools like Excel, SQL, and Python, while the right hemisphere favors storytelling, holistic thinking, and visualization tools like Tableau and Power BI dashboards. For more on brain dominance, visit Healthline, Harvard Health, and Verywell Mind.
This concept aligns with research on hemispheric specialization—the idea that each brain hemisphere is better suited for certain tasks. For example:
Left-Brain Functions: Logical reasoning, sequential thinking, numerical computation, and structured problem-solving.
Right-Brain Functions: Pattern recognition, creative visualization, emotional interpretation, and intuitive thinking.
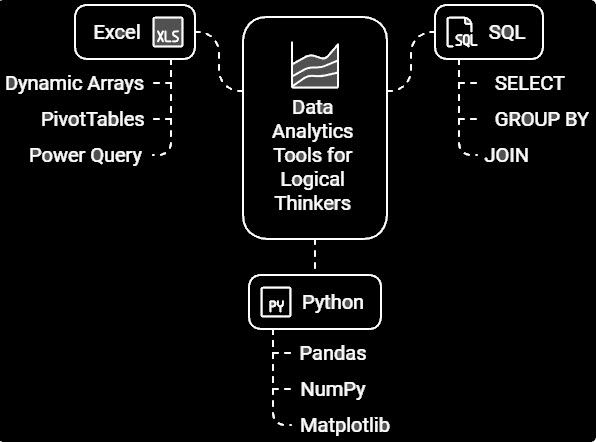
For left-brain thinkers, analytical tools provide the logical structure and precision needed to analyze large data sets effectively. Data collection is a crucial first step in the data analysis process, ensuring that the data you work with is accurate and comprehensive. Here are some of the best data analytics tools:
1. Excel for Data Analysis
Excel is a cornerstone tool for data analysts worldwide. With advanced formulas, pivot tables, and Power Query, Excel makes it easy to clean, analyze, and present data. Key features include:
Dynamic Arrays: Handle complex calculations efficiently.
PivotTables: Summarize data and extract insights.
Power Query: A must-have for data cleaning and transformation.
Learn more about Excel’s capabilities at Microsoft Excel Overview.
2. SQL for Big Data Analytics
Structured Query Language (SQL) is the backbone of big data analytics. SQL allows analysts to query, manipulate, and aggregate large datasets stored in relational databases. Key SQL techniques include:
SELECT for retrieving data.
GROUP BY for summarization.
JOIN for combining multiple tables.
3. Python for Automation
Python’s libraries—like Pandas for data manipulation, NumPy for computations, and Matplotlib for visualization—are ideal for handling data-intensive tasks. Python is especially effective for predictive analytics and automating repetitive workflows.
Get started with Python for data analysis at Python.org.
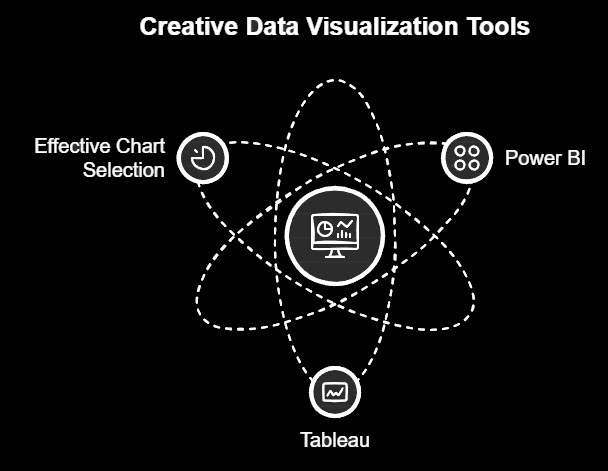
Creative thinkers excel in creating impactful visuals using data visualization tools that tell a story. Here are the most popular data storytelling tools:
1. Power BI for Dashboards
Power BI is a powerful business intelligence tool for creating dynamic dashboards and reports. Features include:
Interactive Filters: Let users explore data interactively.
Custom Visuals: Use advanced chart types to enhance storytelling.
DAX (Data Analysis Expressions): Add calculated fields to your visuals.
Explore Power BI’s features at Microsoft Power BI.
2. Tableau for Storytelling
Tableau is another popular tool for visualization, offering intuitive drag-and-drop functionality for creating compelling data stories. Use Tableau’s storytelling feature to guide audiences through key findings.
Learn more at Tableau Official Website.
3. Effective Chart Selection
Choosing the right chart type is crucial for clear communication:
Bar Charts: Compare categories.
Line Charts: Display trends over time.
Scatter Plots: Highlight relationships between variables.
For chart design tips, visit Storytelling with Data.
Effective data storytelling bridges the gap between analysis and communication, transforming raw data into actionable data insights. Tools like Tableau and Power BI enable you to visualize data to draw key insights in ways that resonate with your audience. A well-crafted data story combines data with narrative elements to create an engaging and informative tale that helps articulate insights and drive decisions.
Understand Your Audience: Tailor your narrative to their needs.
Define Your Key Message: Focus on one clear insight.
Design for Impact: Use clean, easy-to-read visuals.
Developing strong data storytelling skills is essential for effectively communicating complex data findings to a broader audience.
Integration Strategies
Combining data analytics tools and storytelling techniques enhances both accuracy and impact. Here’s how to integrate:
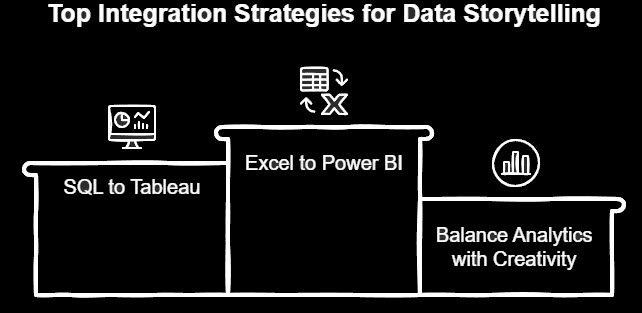
Excel to Power BI: Start with Excel for data preparation and cleaning, then import the dataset into Power BI to create interactive dashboards.
SQL to Tableau: Use SQL for database queries and connect the output to Tableau for visually-rich dashboards that update in real-time.
Balance Analytics with Creativity: While data analysis tools focus on accuracy, visualization tools add the creative touch that helps stakeholders understand complex findings.
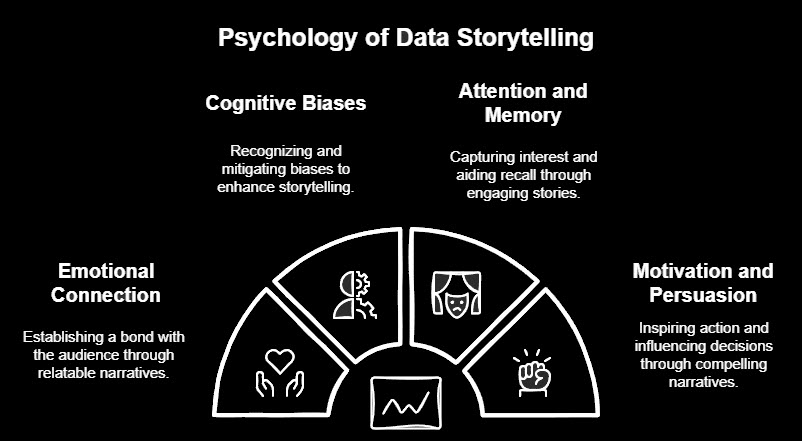
The psychology of data storytelling is a critical aspect of effective data communication. Data storytelling leverages the brain’s preference for stories over pure data to communicate insights and inspire action. Here are some key psychological principles to consider:
Emotional connection: Create an emotional connection with the audience by using storytelling techniques such as characters, setting, conflict, and resolution.
Cognitive biases: Be aware of cognitive biases such as confirmation bias and anchoring bias, and use storytelling techniques to mitigate their impact.
Attention and memory: Use storytelling techniques to capture the audience’s attention and improve memory recall.
Motivation and persuasion: Use storytelling techniques to motivate and persuade the audience to take action.
By understanding the psychology of data storytelling, you can create a narrative that resonates with the audience and inspires action.
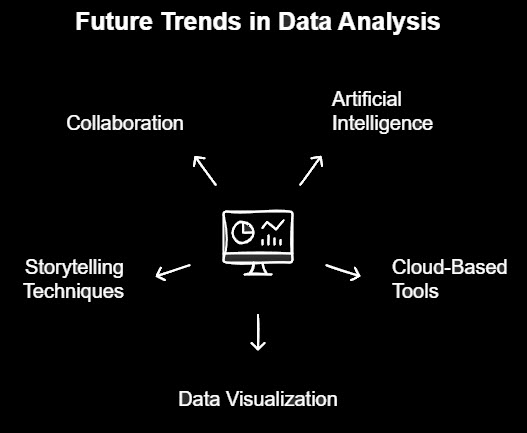
The future of data analysis and storytelling is exciting and rapidly evolving. Here are some trends to watch:
Artificial intelligence: Artificial intelligence will play a larger role in data analysis and storytelling, enabling faster and more accurate insights.
Cloud-based tools: Cloud-based tools will become more prevalent, enabling greater collaboration and scalability.
Data visualization: Data visualization will continue to evolve, enabling more effective communication of insights and patterns.
Storytelling techniques: Storytelling techniques will become more sophisticated, enabling more effective communication of insights and inspiration of action.
Collaboration: Collaboration between data analysts, data scientists, and business stakeholders will become more critical, enabling more effective communication of insights and inspiration of action.
By staying ahead of these trends, you can ensure that your data analysis and storytelling skills remain relevant and effective in the future.
Mastering both analytical tools and storytelling techniques is crucial for modern data professionals. While left-brain thinkers excel in logical data manipulation with data analytics tools like Excel, SQL, and Python, right-brain thinkers thrive in visualization and storytelling using Power BI and Tableau.
By integrating these tools and techniques into your workflow, you can balance the precision of analytics with the creativity of storytelling. Whether you’re analyzing big data, preparing a list of data analytics tools for your resume, or communicating business insights, this guide provides the foundation for success.

92% of students automate workflows, build CEO-ready dashboards, and streamline collaboration in < 1 hour. Don’t miss out!
🎯Master every Office 365 tool like Excel, Word, PowerPoint, Teams, Outlook and OneNote.
🎯Streamlined approach—no fluff, just rapid skill-building.
🎯Eliminate tedious tasks with intelligent automation.
🎯Transform everyday workflows into strategic power moves.
🎯Boost productivity and impress every boss.
🎯Real-World Projects – directly translate lessons into workplace wins.