Learn the 5 types of analytics: descriptive, diagnostic, predictive, prescriptive, and cognitive. How each transforms business data into action with real examples and strategies.
by Mihir Kamdar / Last Updated:
After reading this guide, you’ll be equipped with the knowledge to:
In today’s data-centric world, business analytics is the foundation of decision making, operational efficiency, and innovation. Companies must interpret and leverage large volumes of data for informed decision-making, making business analytics essential. While all analytics extracts insights from data, they serve different purposes and answer different questions.
This guide will cover the 5 types of analytics—descriptive, diagnostic, predictive, prescriptive, and cognitive—how each works, real world examples and tools to implement them properly. Whether you’re looking at historical data, finding root cause, predicting trends, prescribing actions or interpreting unstructured data with cognitive techniques, mastering these analytics types will take your business strategy to the next level.
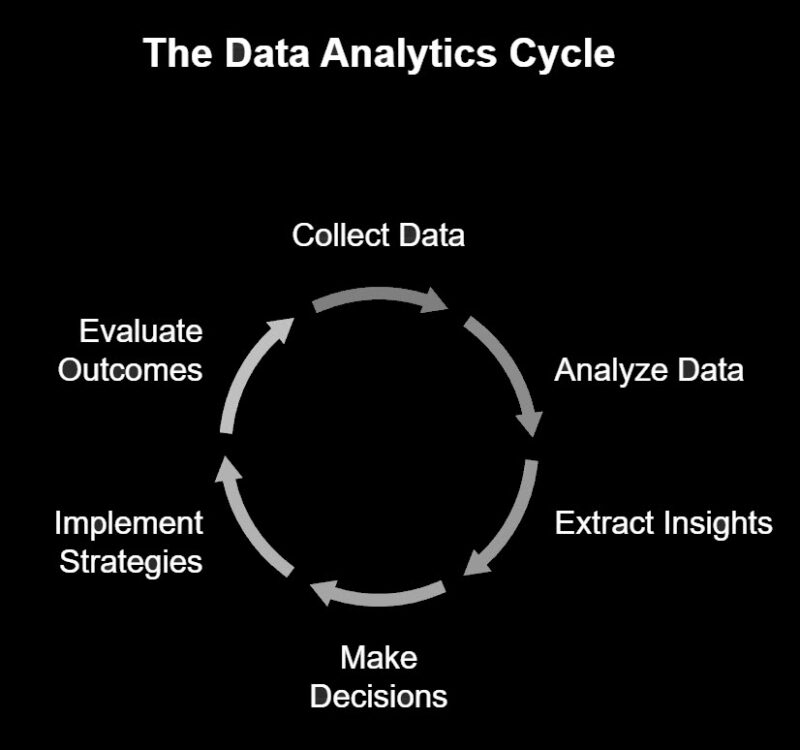
Data analytics is the process of examining data sets to draw meaningful conclusions about the information they contain. This involves using various techniques, tools, and methods to analyze and interpret data, with the ultimate goal of extracting insights and knowledge that can inform business decisions. Data analytics can be applied to a wide range of data types, including customer data, financial data, and operational data.
By analyzing data, organizations can gain a deeper understanding of their customers, markets, and operations. This understanding enables them to make data-driven decisions that drive business success. For instance, analyzing customer data can reveal purchasing patterns and preferences, helping businesses tailor their marketing strategies and improve customer satisfaction. Similarly, analyzing financial data can uncover trends and anomalies, aiding in better financial planning and risk management.
In essence, data analytics transforms raw data into actionable insights, empowering organizations to make informed decisions and stay competitive in their respective industries.
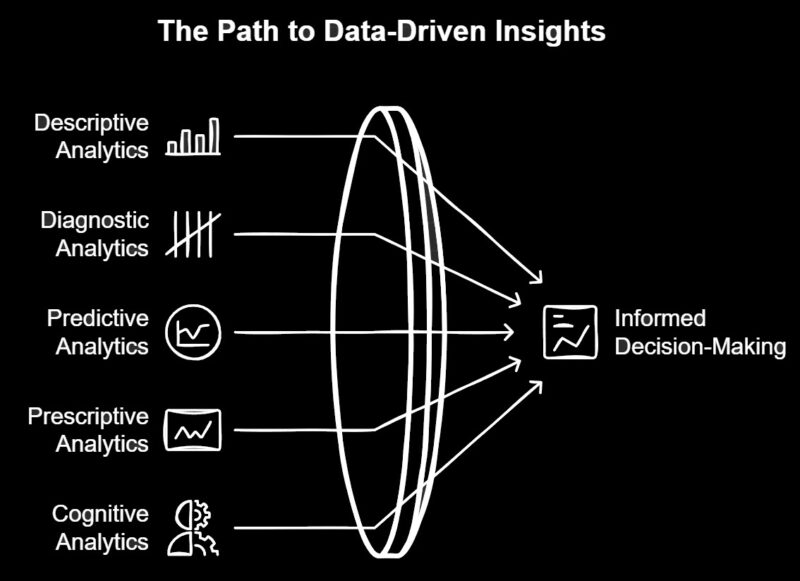
Types of data analytics can be broken down into five types, each answering:
What?
Why? (Diagnostics analytics helps businesses understand the reasons behind past events and outcomes, identifying trends and patterns, and explaining why certain results occurred.)
What next?
What to do?
How can we interpret and respond to complex data?
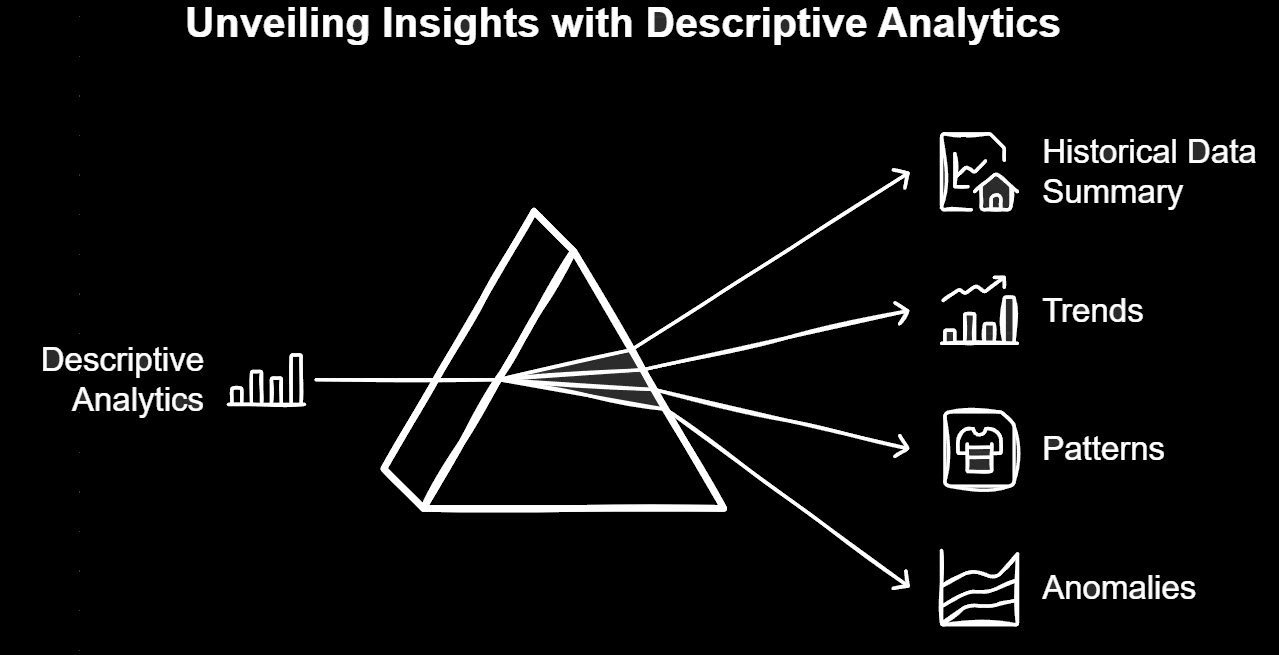
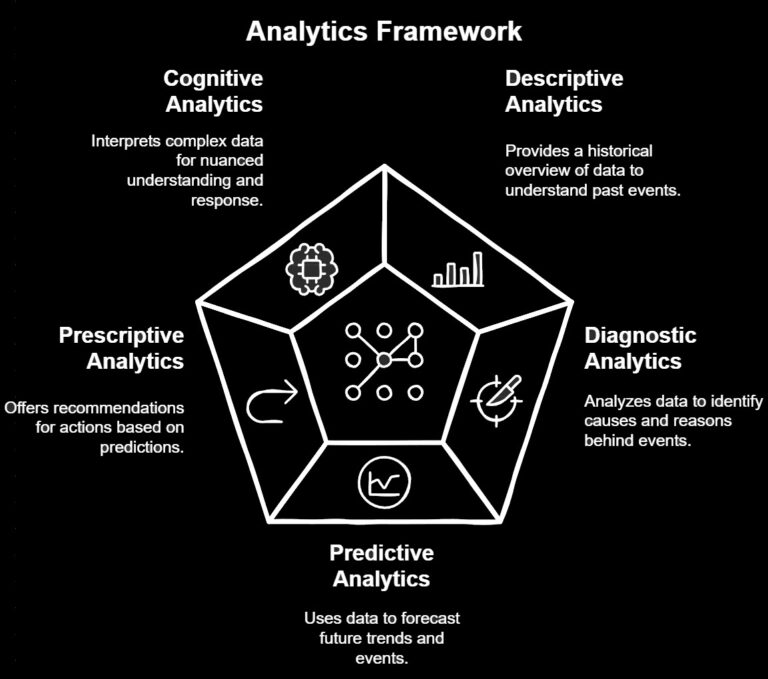
Descriptive analytics gives you a summary of historical data, showing trends, patterns and anomalies. It’s the foundation for further analysis by answering the question, “What happened?”
How it’s used:
Example: A retailer sees a 40% sales increase in December compared to November, a holiday shopping trend.
Key Tools:
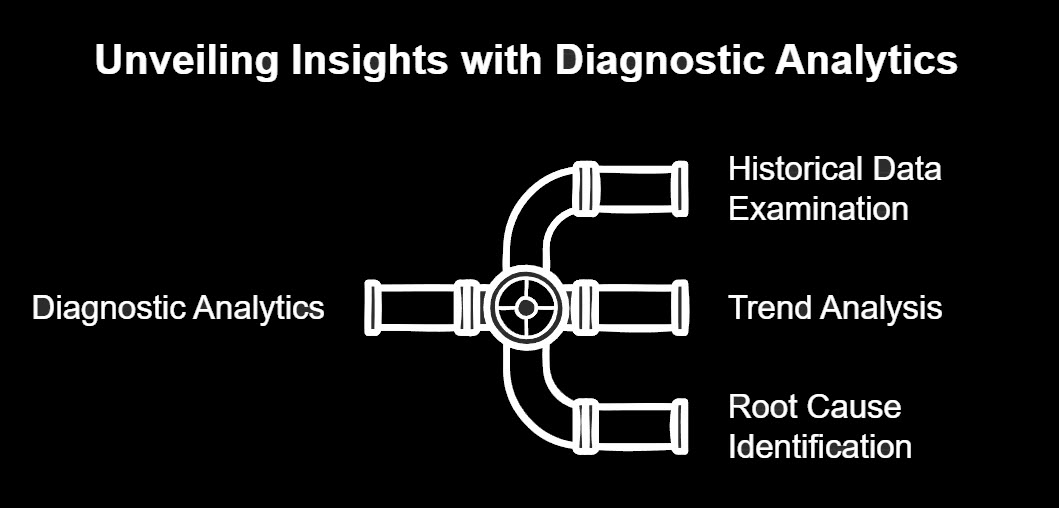
Diagnostic analytics digs deeper to find the root cause of historical trends, answers the question, “Why did it happen?”
How it’s used:
Example:
A telecom company finds out that unresolved billing issues are the main reason for customer churn.
Key Tools:
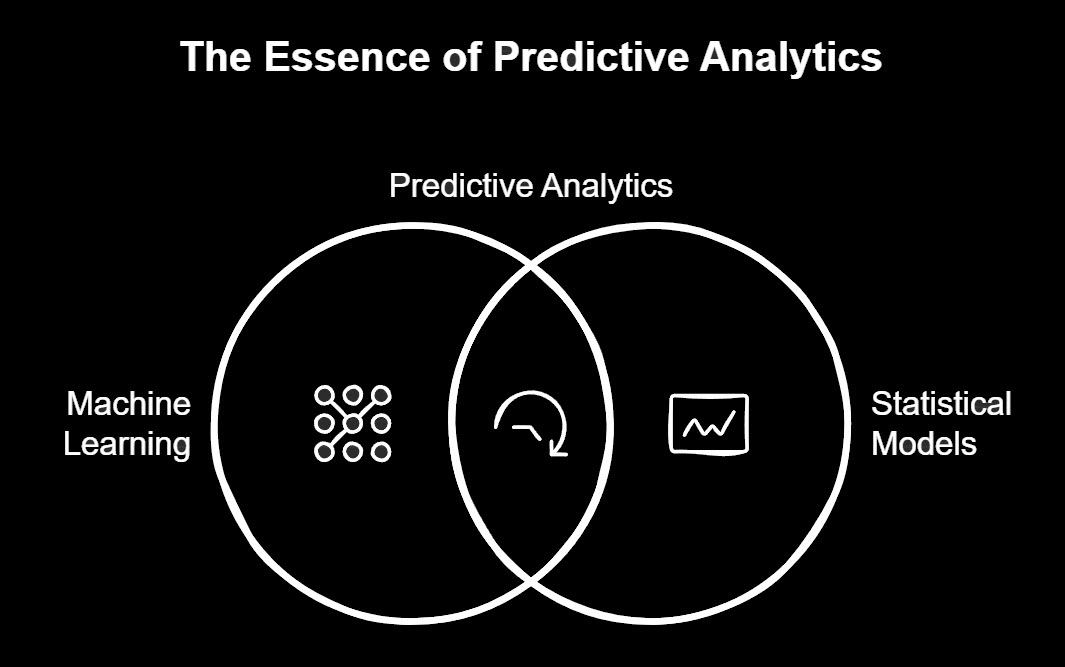
Predictive analytics uses machine learning, statistical models and historical data to forecast future outcomes, answers the question, “What next?”
Statistical modeling plays a crucial role in analyzing large datasets and making educated forecasts, enhancing the accuracy of predictions for businesses aiming to identify potential outcomes and set strategic goals.
How it’s used:
Example: A hospital predicts a 30% increase in flu cases, so they can better resource.
Key Tools:
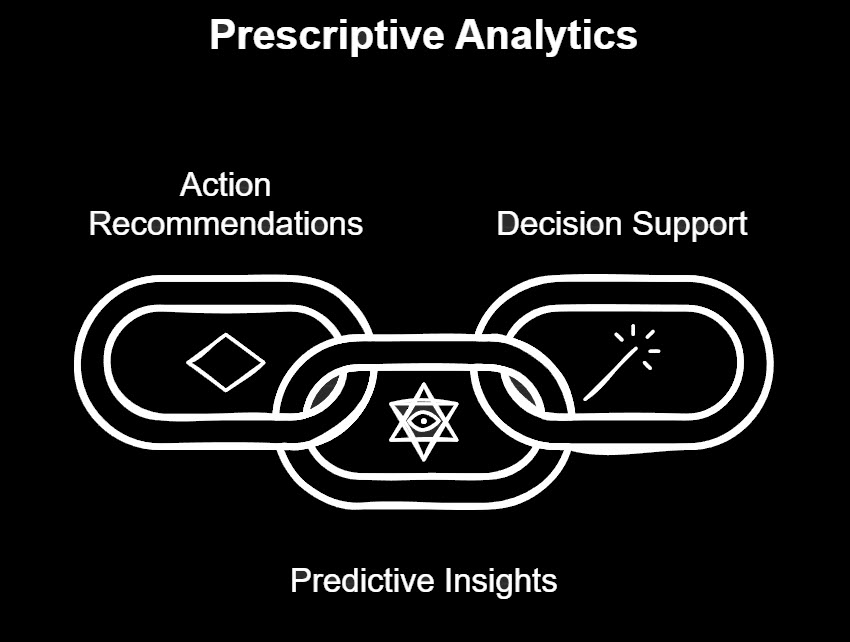
Prescriptive analytics recommends actions based on predictive insights, answers the question, “What to do?”
How it’s used:
Example:
A retailer uses prescriptive analytics to recommend inventory for the holiday season.
Key Tools:
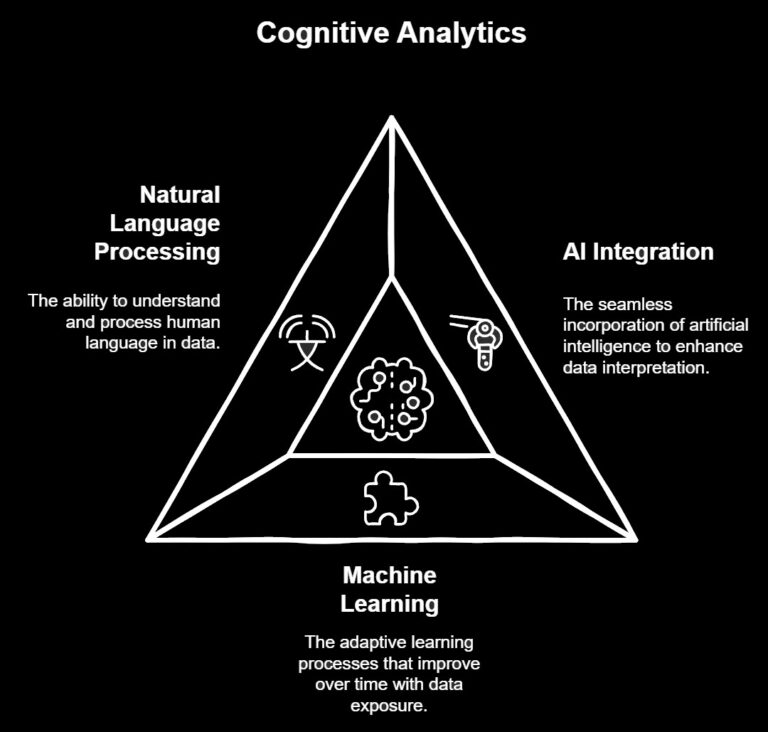
Cognitive analytics combines AI, machine learning and natural language processing to interpret unstructured data (like text, images and audio), answers the question, “How can we interpret and respond to complex data?”
How it’s used:
Example:
A retail company uses cognitive analytics to analyze customer reviews, finds out recurring complaints about delivery delays and addresses it to improve satisfaction.
Key Tools:
Working with historical data is a cornerstone of effective data analytics. Historical data, which encompasses data collected and stored over time, is invaluable for analyzing past trends, patterns, and events. By delving into historical data, businesses can uncover insights into their past performance, pinpoint areas for improvement, and make informed decisions about future strategies.
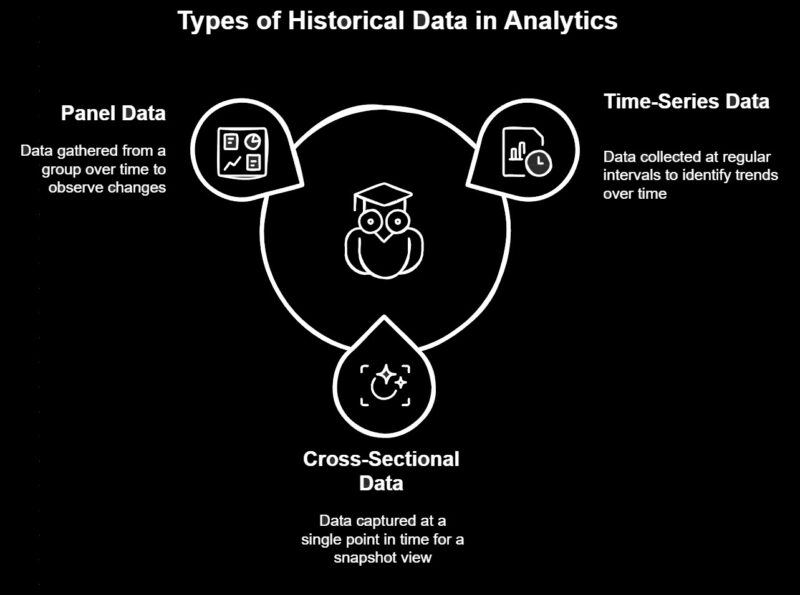
There are several types of historical data that businesses commonly work with:
Time-series data: Collected at regular intervals, such as daily sales figures or monthly website traffic, this data helps identify trends over time.
Cross-sectional data: Captured at a single point in time, like a customer opinion survey or a snapshot of employee demographics, this data provides a snapshot of a specific moment.
Panel data: Gathered from a group of individuals or organizations over a period, such as a longitudinal study of customer behavior, this data offers insights into changes over time.
To build a complete analytics framework, integrate all 5 in order:
Start with Descriptive Analytics: What happened?
Use Diagnostic Analytics: What to do?
Leverage Predictive Analytics: What might happen?
Implement Prescriptive Analytics: What to do based on predictions.
Incorporate Cognitive Analytics: How to interpret and respond to complex data.
Business intelligence is crucial for making informed decisions, reducing costs, and improving overall organizational performance by effectively gathering and analyzing data.
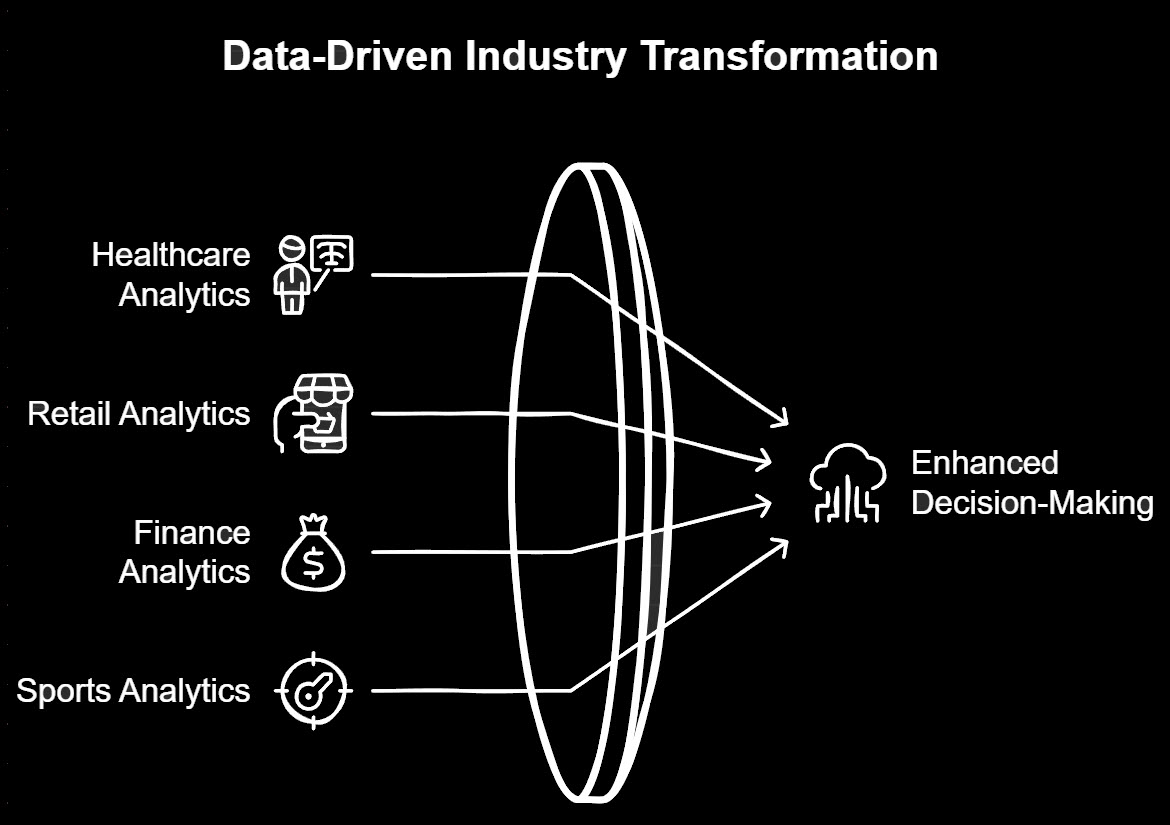
1. Healthcare:
2. Retail:
3. Finance:
4. Sports:
Measuring the success of analytics initiatives is critical to ensuring that organizations are maximizing their analytics investments. Several metrics can be used to gauge the effectiveness of analytics efforts, including return on investment (ROI), return on equity (ROE), and customer satisfaction. These metrics provide a high-level view of the impact of analytics on business performance.
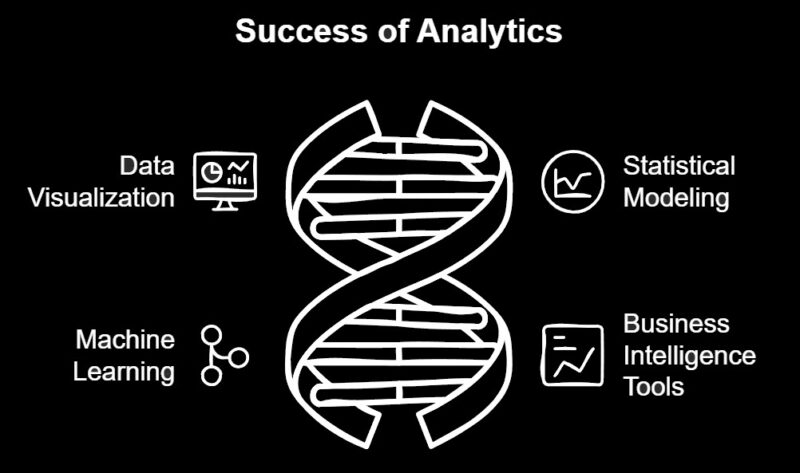
To measure the success of analytics, organizations can use a variety of tools and techniques:
Data Visualization: Tools like Tableau and Power BI can create visual representations of key metrics and performance indicators.
Statistical Modeling: Techniques such as regression analysis can evaluate the accuracy and performance of predictive models.
Machine Learning: Advanced machine learning algorithms can assess the effectiveness of analytics models and identify areas for improvement.
Business Intelligence Tools: Dashboards and reports can track key performance indicators (KPIs) and metrics, providing a comprehensive view of analytics success.
By regularly measuring the success of analytics initiatives, organizations can identify areas for improvement and make data-driven decisions to enhance their analytics capabilities and drive business success.
To get the most out of data, you need to master the 5 types of analytics—descriptive, diagnostic, predictive, prescriptive and cognitive. By integrating them all, you can not only understand what happened but also what will happen, what to do and how to interpret complex data.
With the right tools and strategies you can build a complete analytics framework to make better decisions and innovate in your business.
