This comprehensive guide teaches you how to create an advanced, single-page budget planner in Microsoft Excel to help you track and organize your monthly income and expenses. Learn to leverage Excel’s powerful features like PivotTables, KPIs, and data visualization to build a robust financial management system. Perfect for anyone looking to take control of their finances and gain valuable insights into their spending habits.
by Mihir Kamdar / Last Updated:
By the end of this guide, you’ll know how to:
Set up a comprehensive transaction tracker in Excel
Create dynamic budget summaries using PivotTables
Build an informative dashboard with Key Performance Indicators (KPIs)
Visualize your financial data with charts and graphs
Enhance your tracker’s interactivity using slicers
Analyze your spending patterns and track financial goals effectively
Use an Excel budget tracker where totals and percentages are calculated automatically, saving time and reducing errors
Download our step-by-step tutorial file now by clicking on the icon below and follow along to enhance your Excel skills practically and efficiently!
Excel is a versatile tool that offers powerful features for financial management. Its ability to handle large datasets, perform complex calculations, and utilize a budget spreadsheet makes it ideal for budgeting. Plus, with features like PivotTables and conditional formatting, you can easily analyze your spending patterns and track your financial goals.
To manage your business expenses effectively, it’s important to track them on a monthly basis alongside your personal income. This allows you to ensure your financial health is maintained while investing in personalized advertising strategies that drive growth and ROI.
A budget spreadsheet is an essential tool for anyone looking to effectively manage their finances. It allows individuals to track income, expenses, and savings in an organized format. Many people start by using a budget spreadsheet template to simplify the process, which provides a ready-made structure for managing money. Additionally, there are various excel budget templates available that cater to different budgeting needs, making it easier for users to find the right one for them.
For those who prefer a more personalized approach, a budgeting spreadsheet offers the flexibility to modify categories and track specific financial goals. Whether it’s a budget template excel or a budget excel spreadsheet, these tools are highly adaptable to different financial situations. Some individuals look for a sample budget spreadsheet to get an idea of how to set up their own, and excel budget spreadsheets often serve as great references.
If you prefer simplicity, a simple budget template excel might be the best choice, offering a clean and easy-to-follow format. For those wondering how to make a budget spreadsheet, there are many resources available to guide users through the process, helping them design an efficient and functional spreadsheet. A budgeting worksheet excel or budget worksheet excel can also be useful for more detailed financial planning.
To create a budget from scratch, many turn to guides on how to create a budget spreadsheet or how to make a budget in excel, which provide step-by-step instructions. If you’re unsure of the specifics, you may ask how do you make a budget spreadsheet, with several online tools and tutorials available to answer these questions. With these various options, anyone can find a solution that fits their financial planning needs.
To make a budget in Excel, start by setting up a transaction tracker with categories for income and expenses. Use PivotTables for dynamic summaries and KPIs for tracking key metrics like income, expenses, and savings. Visualize your data with charts such as pie and bar graphs. Enhance interactivity using slicers to filter by categories or time periods. Finally, organize your dashboard for an intuitive overview of your financial situation.
A budget sheet excel is a widely-used tool for organizing finances, tracking income and expenses, and staying on top of spending. If you’re wondering how to create a budget in excel, it’s quite simple with built-in templates or by manually creating your own layout. Many users turn to a budget excel for basic financial tracking, and excel template for budget options provide pre-designed structures to ease the process.
For a more easy excel budget template, there are user-friendly designs that allow quick customization, making it a great choice for beginners. A financial spreadsheet in Excel can be used not just for budgeting, but also for tracking investments, debts, and other financial metrics. The budget excel sheet is another option for users looking to monitor and control their finances in a straightforward manner.
If you’re looking to organize your monthly spending, you can make a monthly time table on excel sheet on monthly spendings, which allows for effective tracking of recurring expenses. Learning how to prepare a budget on excel can give you more control over your financial decisions. For those interested in more specific examples, a sample personal budget excel or budget sheet example might be helpful as starting points.
For anyone seeking more clarity on how to manage personal finances, an excel budget sheet or a basic budget template excel is a great place to begin. Whether you’re after a simple budget format excel or a more simple budget layout, you can find the right Excel design to match your preferences. Excel spreadsheet for budget can be tailored for household or business expenses, making it versatile for different budgeting needs. And with resources like budgeting excel spreadsheet, you can find everything you need to start managing your money effectively.
Are you struggling to keep track of your finances? Do you want a powerful tool like a personal budget template to monitor your income, expenses, and savings goals? Look no further! This comprehensive guide will walk you through creating an advanced, single-page budget tracker in Microsoft Excel. By combining a year-long transaction tracker, dynamic PivotTables, and insightful Key Performance Indicators (KPIs), you’ll have a robust financial management system at your fingertips.
Creating a budget template is essential for managing your finances effectively. A well-structured budget template helps you track your income and expenses, identify areas where you can cut back, and make informed decisions about your financial goals. With a budget template, you can:
Get a Clear Picture of Your Financial Situation: By documenting all your income and expenses, you gain a comprehensive view of your financial health.
Set Realistic Financial Goals and Track Progress: Whether you’re saving for a vacation, paying off debt, or building an emergency fund, a budget template helps you set achievable goals and monitor your progress.
Make Informed Decisions About Spending and Saving: With a clear understanding of your financial situation, you can make smarter choices about where to allocate your money.
Reduce Financial Stress and Anxiety: Knowing exactly where your money is going can alleviate the stress and uncertainty that often comes with managing finances.
Improve Your Overall Financial Health: Regularly using a budget template can help you develop better financial habits, leading to long-term financial stability and security.
Using a budget template can also help you avoid common financial pitfalls, such as overspending, accumulating debt, and experiencing financial instability. By taking control of your finances with a budget template, you can achieve financial peace of mind and security.
The foundation of your budget tracker is a detailed transaction log. Here’s how to set it up:
1. In cell A1, type “Transaction Tracker” and format it as a title.
2. In row 2, create the following headers: Date, Category, Description, Income, Expense
3. Enhance data accuracy by creating a drop-down list for categories in column R using Data Validation. Include common categories like
4. Select cells A2:E1002 (allowing for 1000 transactions) > Go to Insert > Select Table > Select My Table has Headers > Press OK > Go to Table Design > Name it “TransactionTable”. Change the design as shown below.
5. Enter your data.
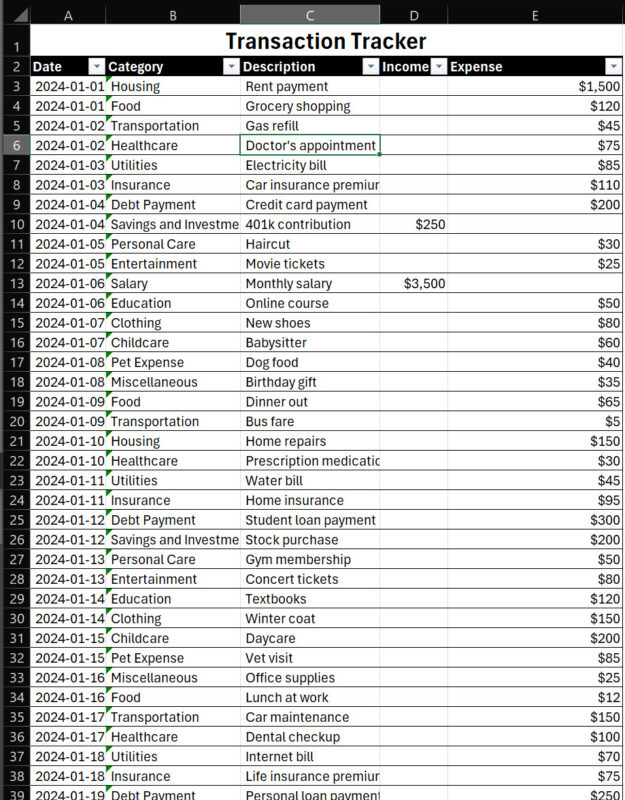
6. Format the columns for optimal data entry:
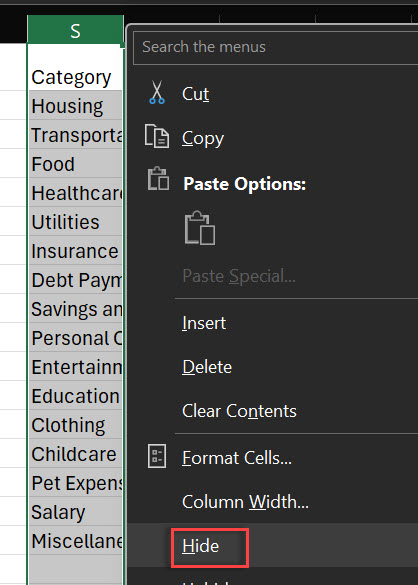
7. Hide Column S.
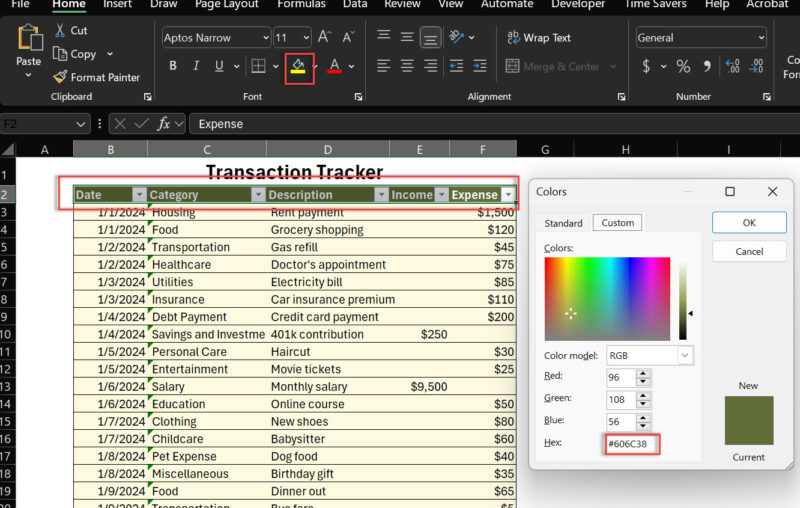
8. Change the header color of the table to HEX 606C38.
Budget spreadsheets, particularly Excel templates, are essential tools for managing your finances effectively. PivotTables are a powerful Excel feature that allows you to summarize and analyze your financial data quickly. Here’s how to create one:
1. Click anywhere in the TransactionTable.
2. Navigate to Insert > PivotTable > Create the PivotTable on the new sheet (Dashboard) in cell B3.
3. In the PivotTable Fields pane, set up your table:
Place “Category” in the Rows area for a breakdown by expense type.
Add “Income” to the Values area, ensuring it’s set to Sum.
Similarly, add “Expense” to the Values area, also set to Sum.
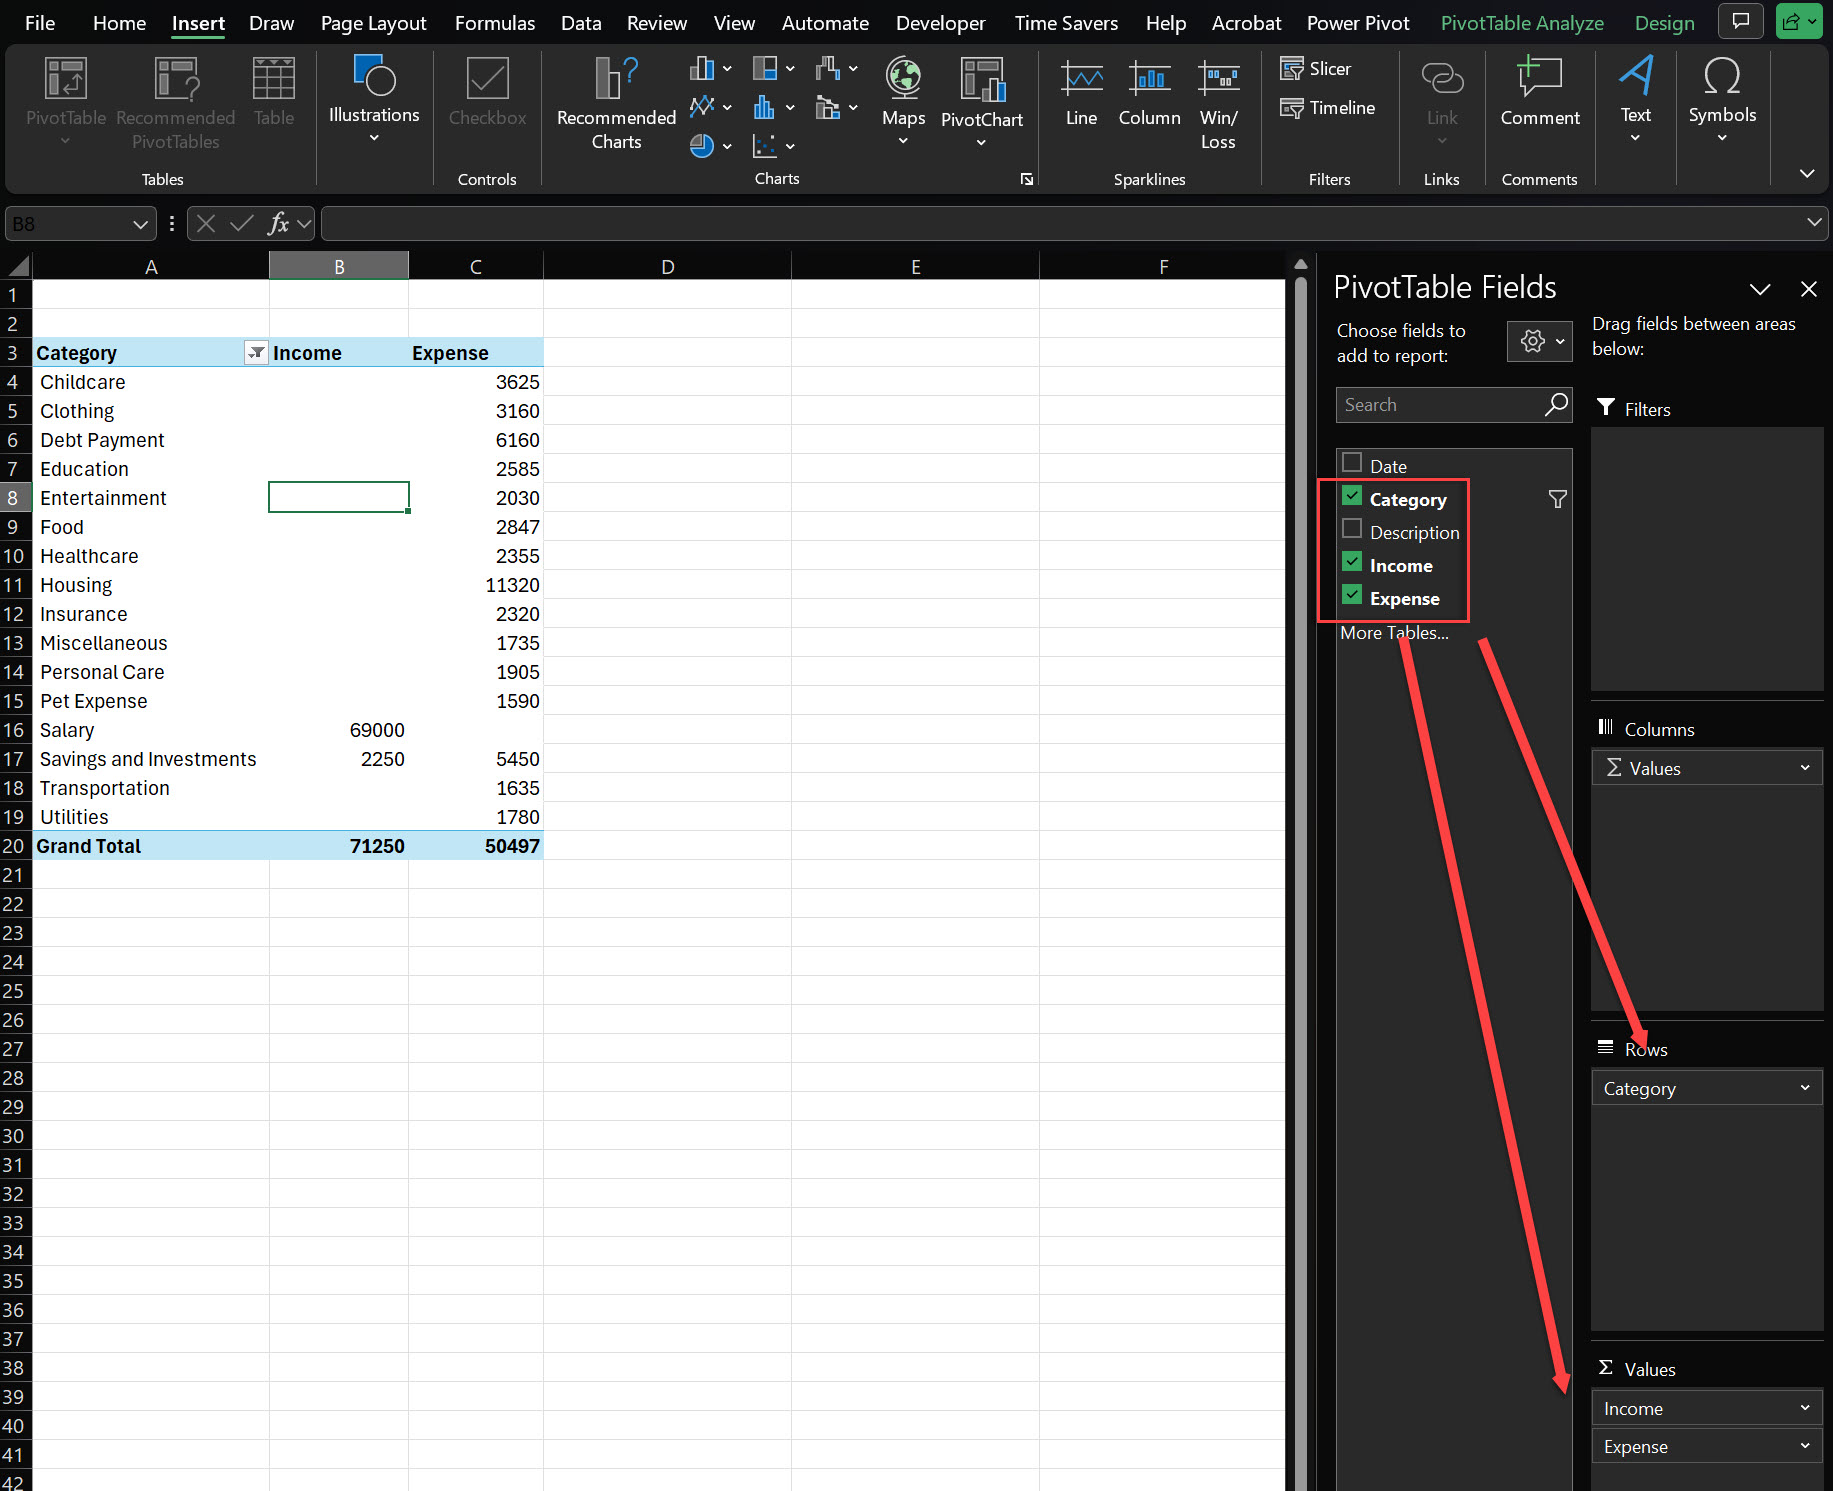
4. For clarity, rename the “Sum of Income” and “Sum of Expense” headers to simply “Income” and “Expense”.
5. Change to Currency data type for Income and Expense.
6. Change the header and grant total background to HEX code 606C38.
By using a PivotTable, your budget summary will automatically update as you add new transactions, saving you time and ensuring your data is always current.
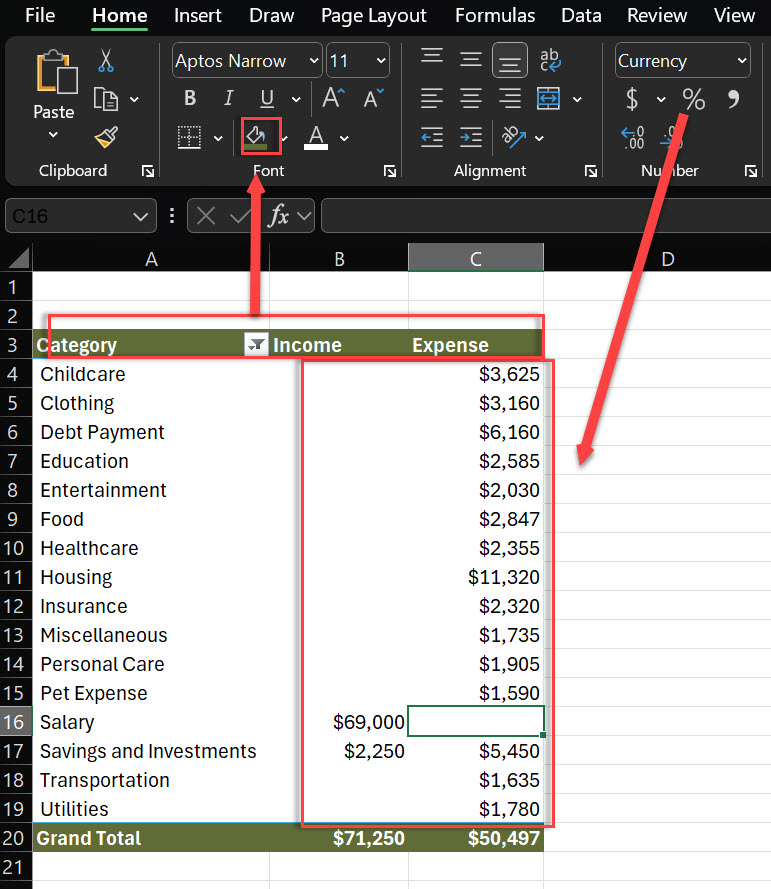
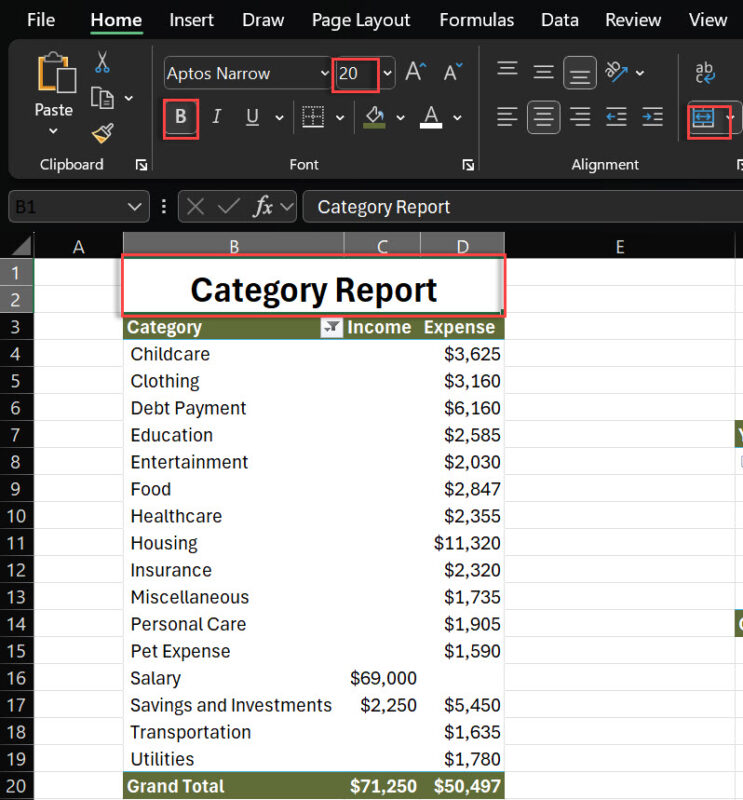
Add the header as Category Report. Make the below section as Merge & Center with 20 font size and bold.
1. Click anywhere in the TransactionTable.
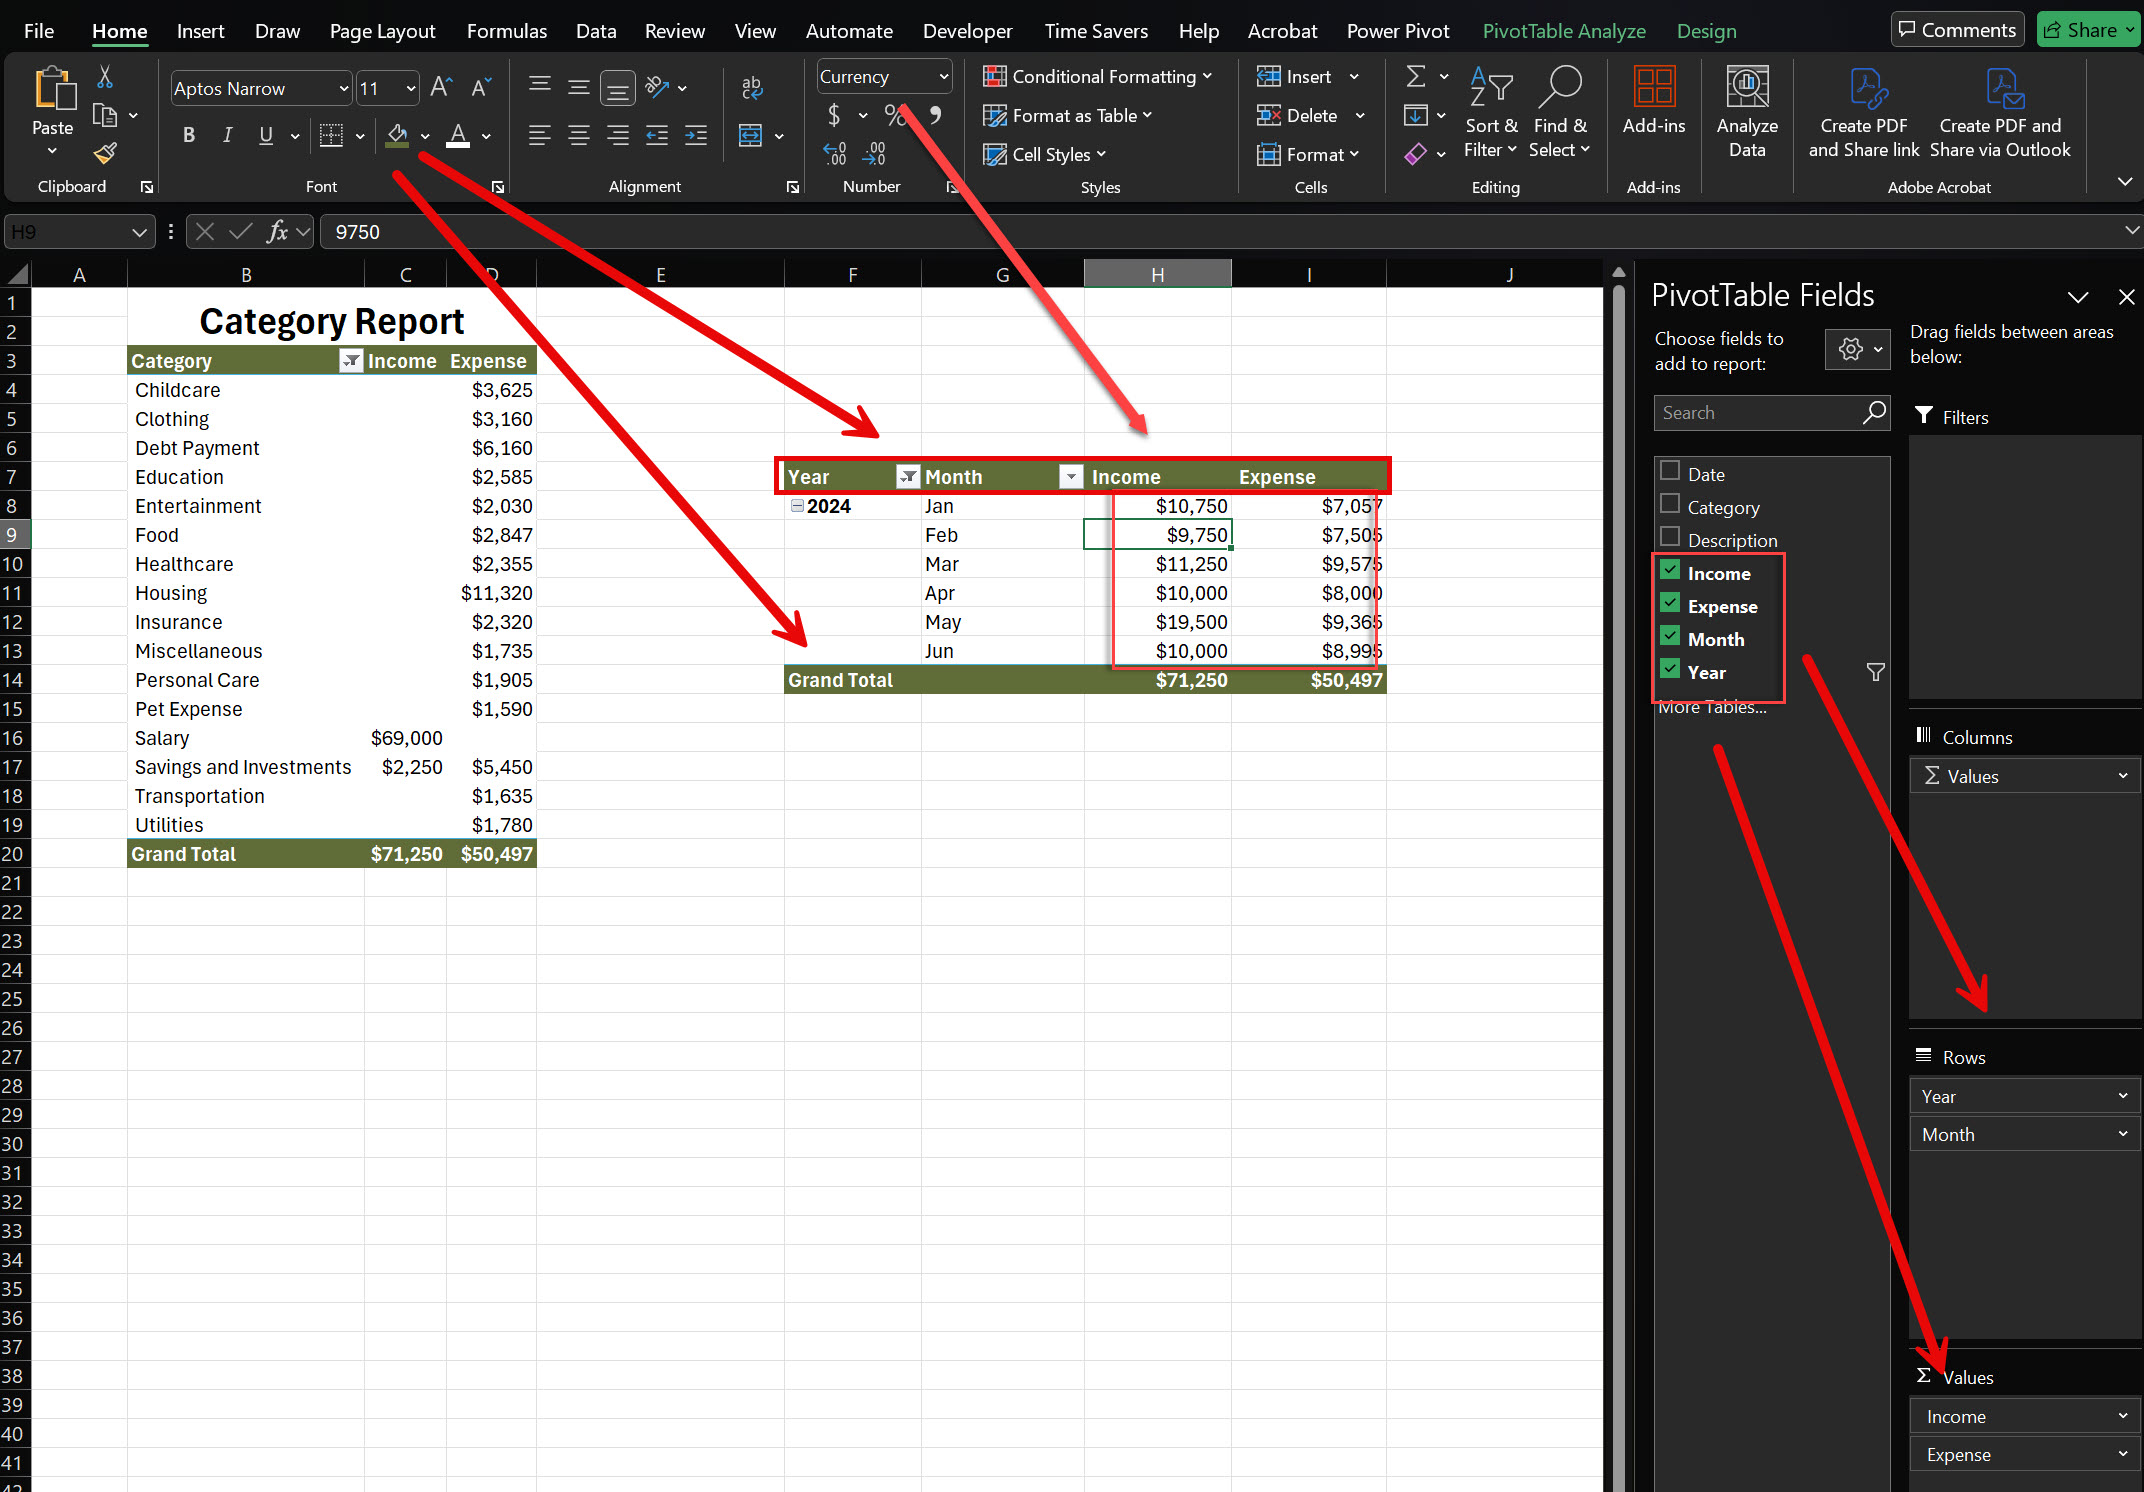
2. Navigate to Insert > PivotTable > Create the PivotTable on the same sheet(Dashboard) in cell F7.
3. In the PivotTable Fields pane, set up your table:
Place “Date” in the Rows area for a breakdown by expense type.
Add “Income” to the Values area, ensuring it’s set to Sum.
Similarly, add “Expense” to the Values area, also set to Sum.
Change Income and Expense to Currency data type.
Remove the Day and add Year field from Rows area.
Rename the header from Years (Date) to Year, Months (Date) to Month, Sum of Expense to Expense and Sum of Income to Income.
Change the header and grant total background to HEX code 606C38.
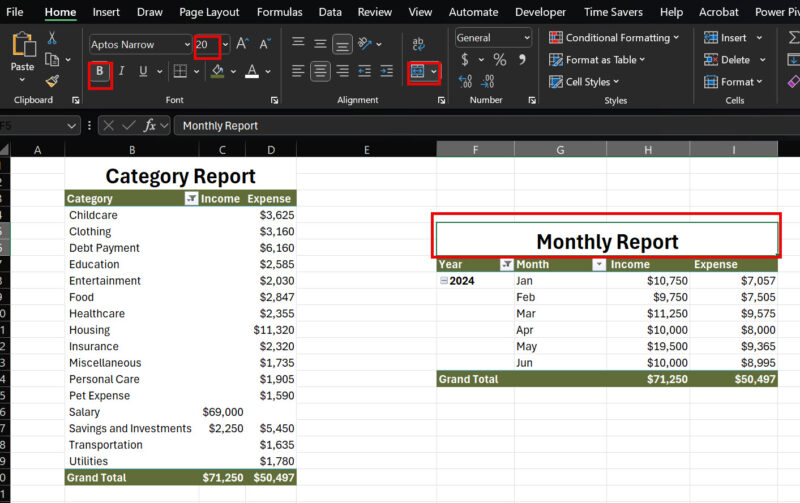
Add the header as Monthly Report. Make the section below as Merge & Center, using 20 font size and bold.
A good budget tracker should provide at-a-glance insights into your financial health. Let’s create a dashboard with key performance indicators (KPIs):
A. Total Income KPI:
Label: “Income”
Formula: =SUM(TransactionTable[Income])
Format as Currency

B. Total Expense KPI:
Label: “Expense”
Formula: =SUM(TransactionTable[Expense])
Format as Currency

C. Net Savings KPI:
Label: “Net Savings”
Formula: =F3 – G3
Format as Currency

D: Saving Rate
Label: “Saving Rate”
Formula: = H3 / F3
Format as Percentage

Select all the Header > Go to Home > Cell Styles > Select Check Cells > Change the color to HEX code 606C38.
Change the below cell styles to Output.

These KPIs provide a quick snapshot of your financial health, allowing you to assess your progress toward your financial goals quickly. A well-structured monthly budget plan can help save money by identifying areas to reduce expenses.
Now, we need to create a KPI. Go to Insert > Select and Draw a Rectangle.
Copy paste the shape 3 more times and change the color as per below HEX code.

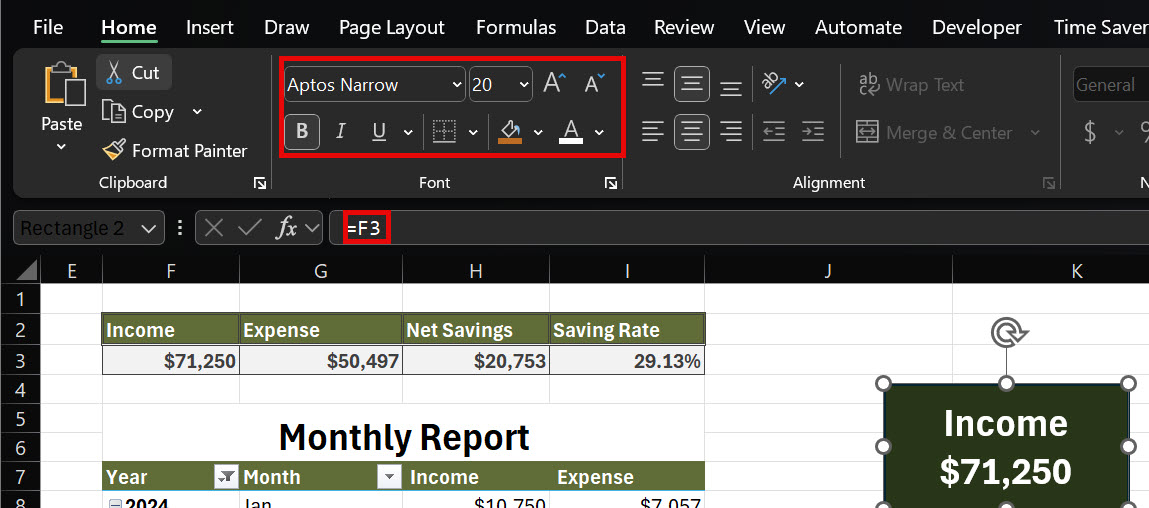
Add the label ‘Income’ and select cell F3 > Increate the font size to 20, center-aligned and white color.
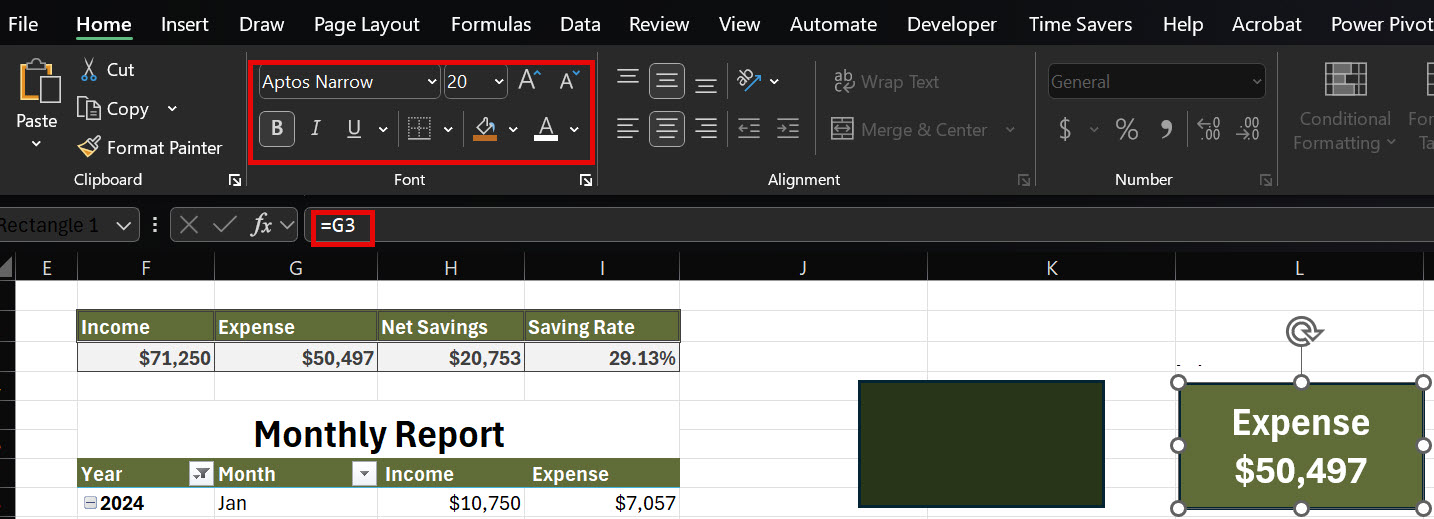
Add the label ‘Expense’ and select cell G3 > Increate the font size to 20 center-aligned and white color.
Add the label ‘Net Savings’ and select cell H3 > Increate the font size to 20, center-aligned and black color.

Add the label ‘Saving Rate’ and select cell I3 > Increate the font size to 20, center-aligned and black color.

Charts can help you understand your financial patterns at a glance. Add these visualizations to your dashboard:
1. Income vs. Expense Breakdown Pie Chart:

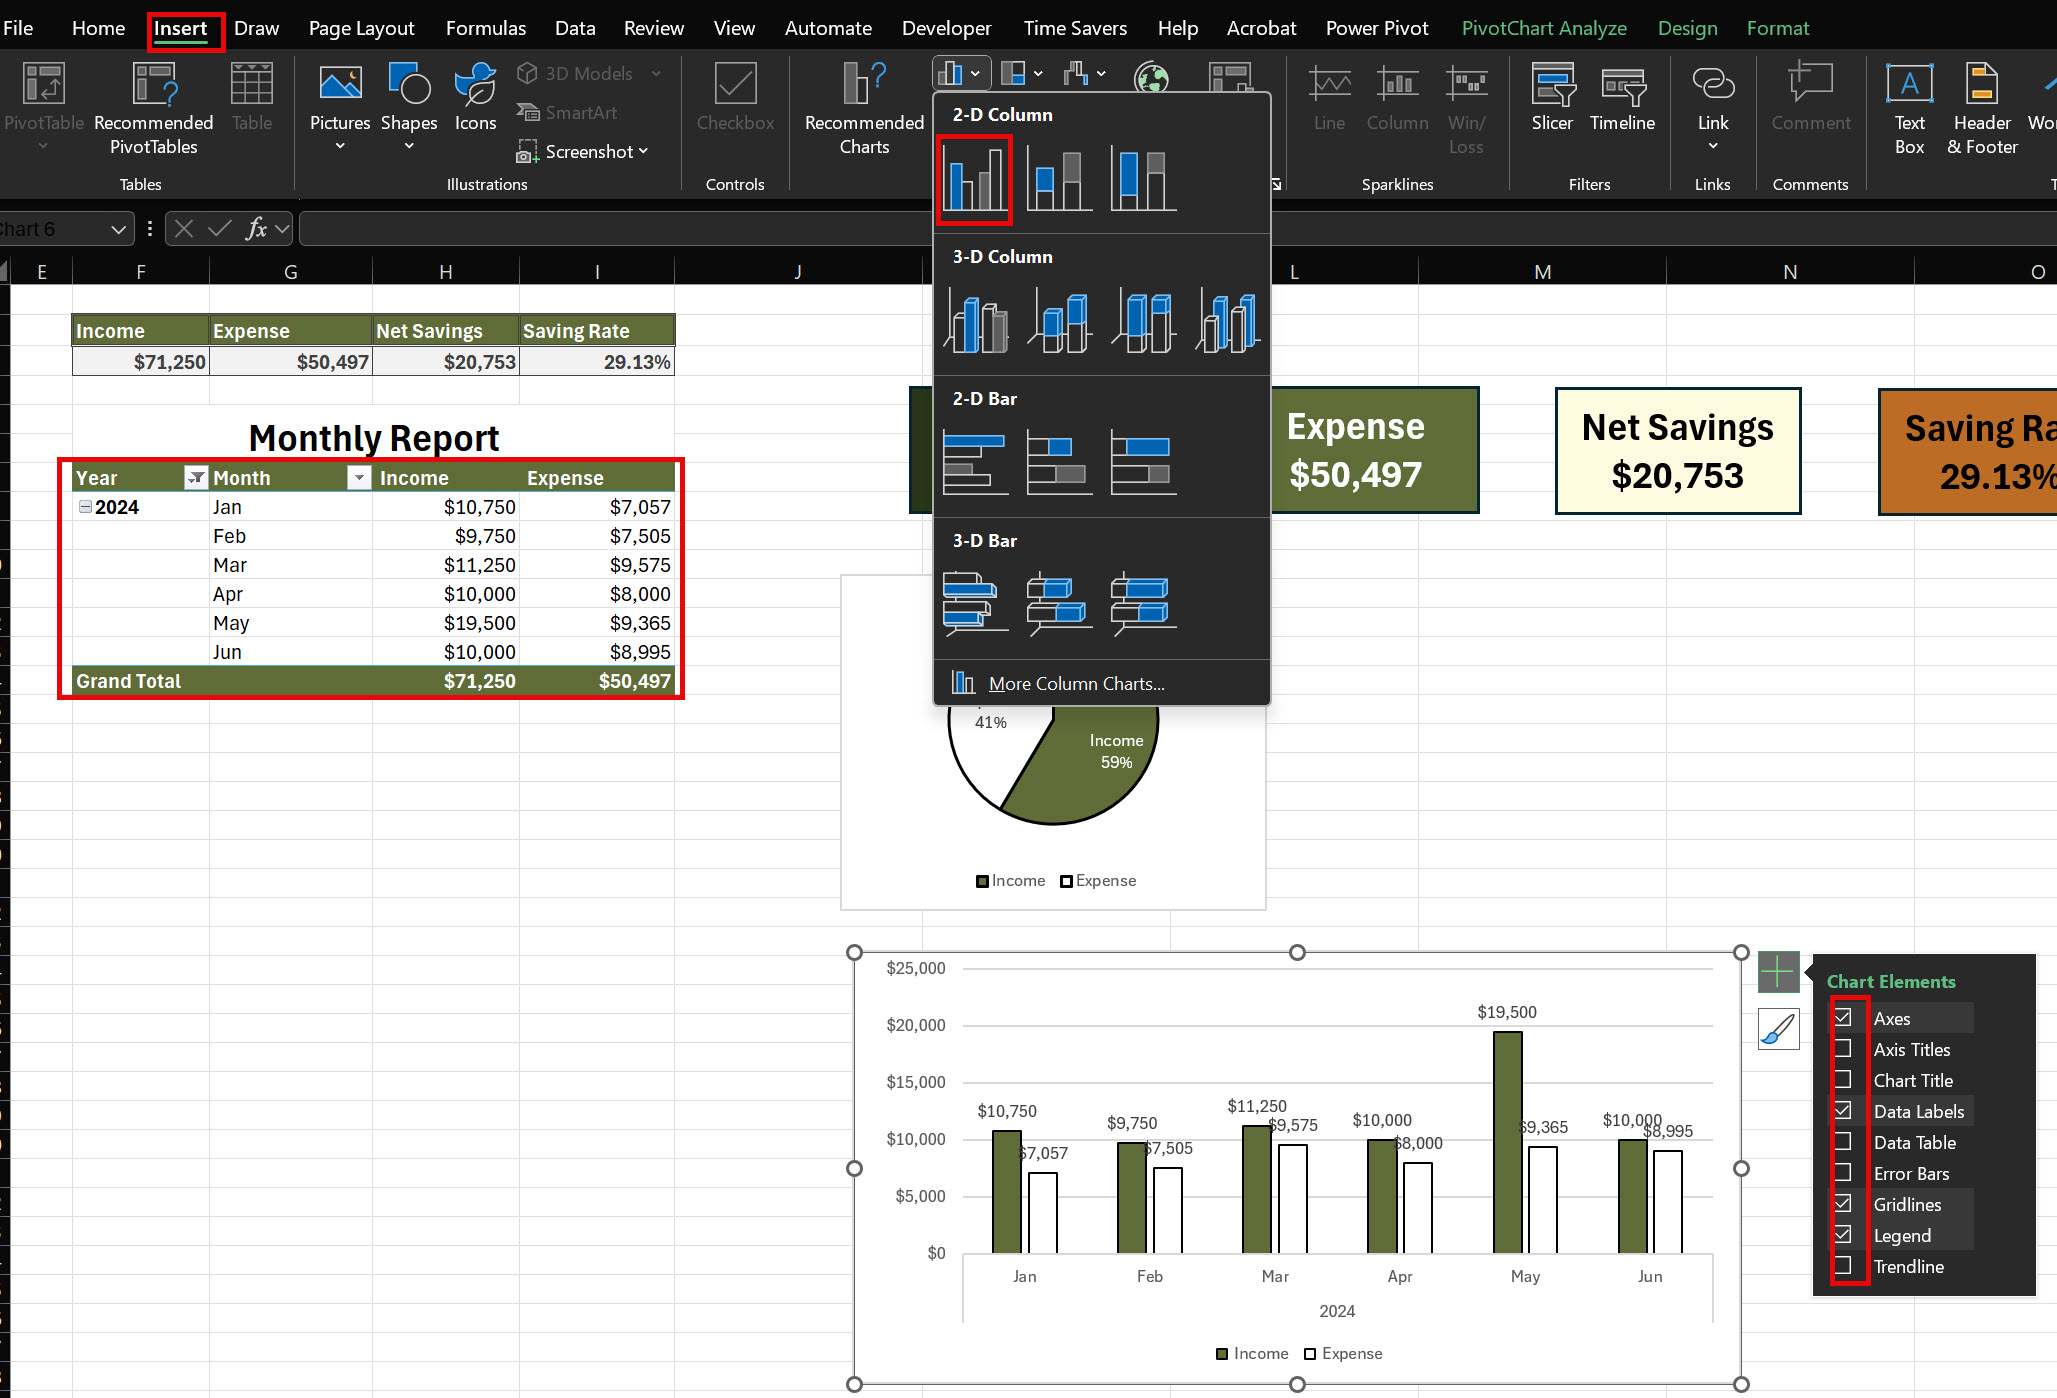
2. Monthly Income vs. Expenses Column Chart:
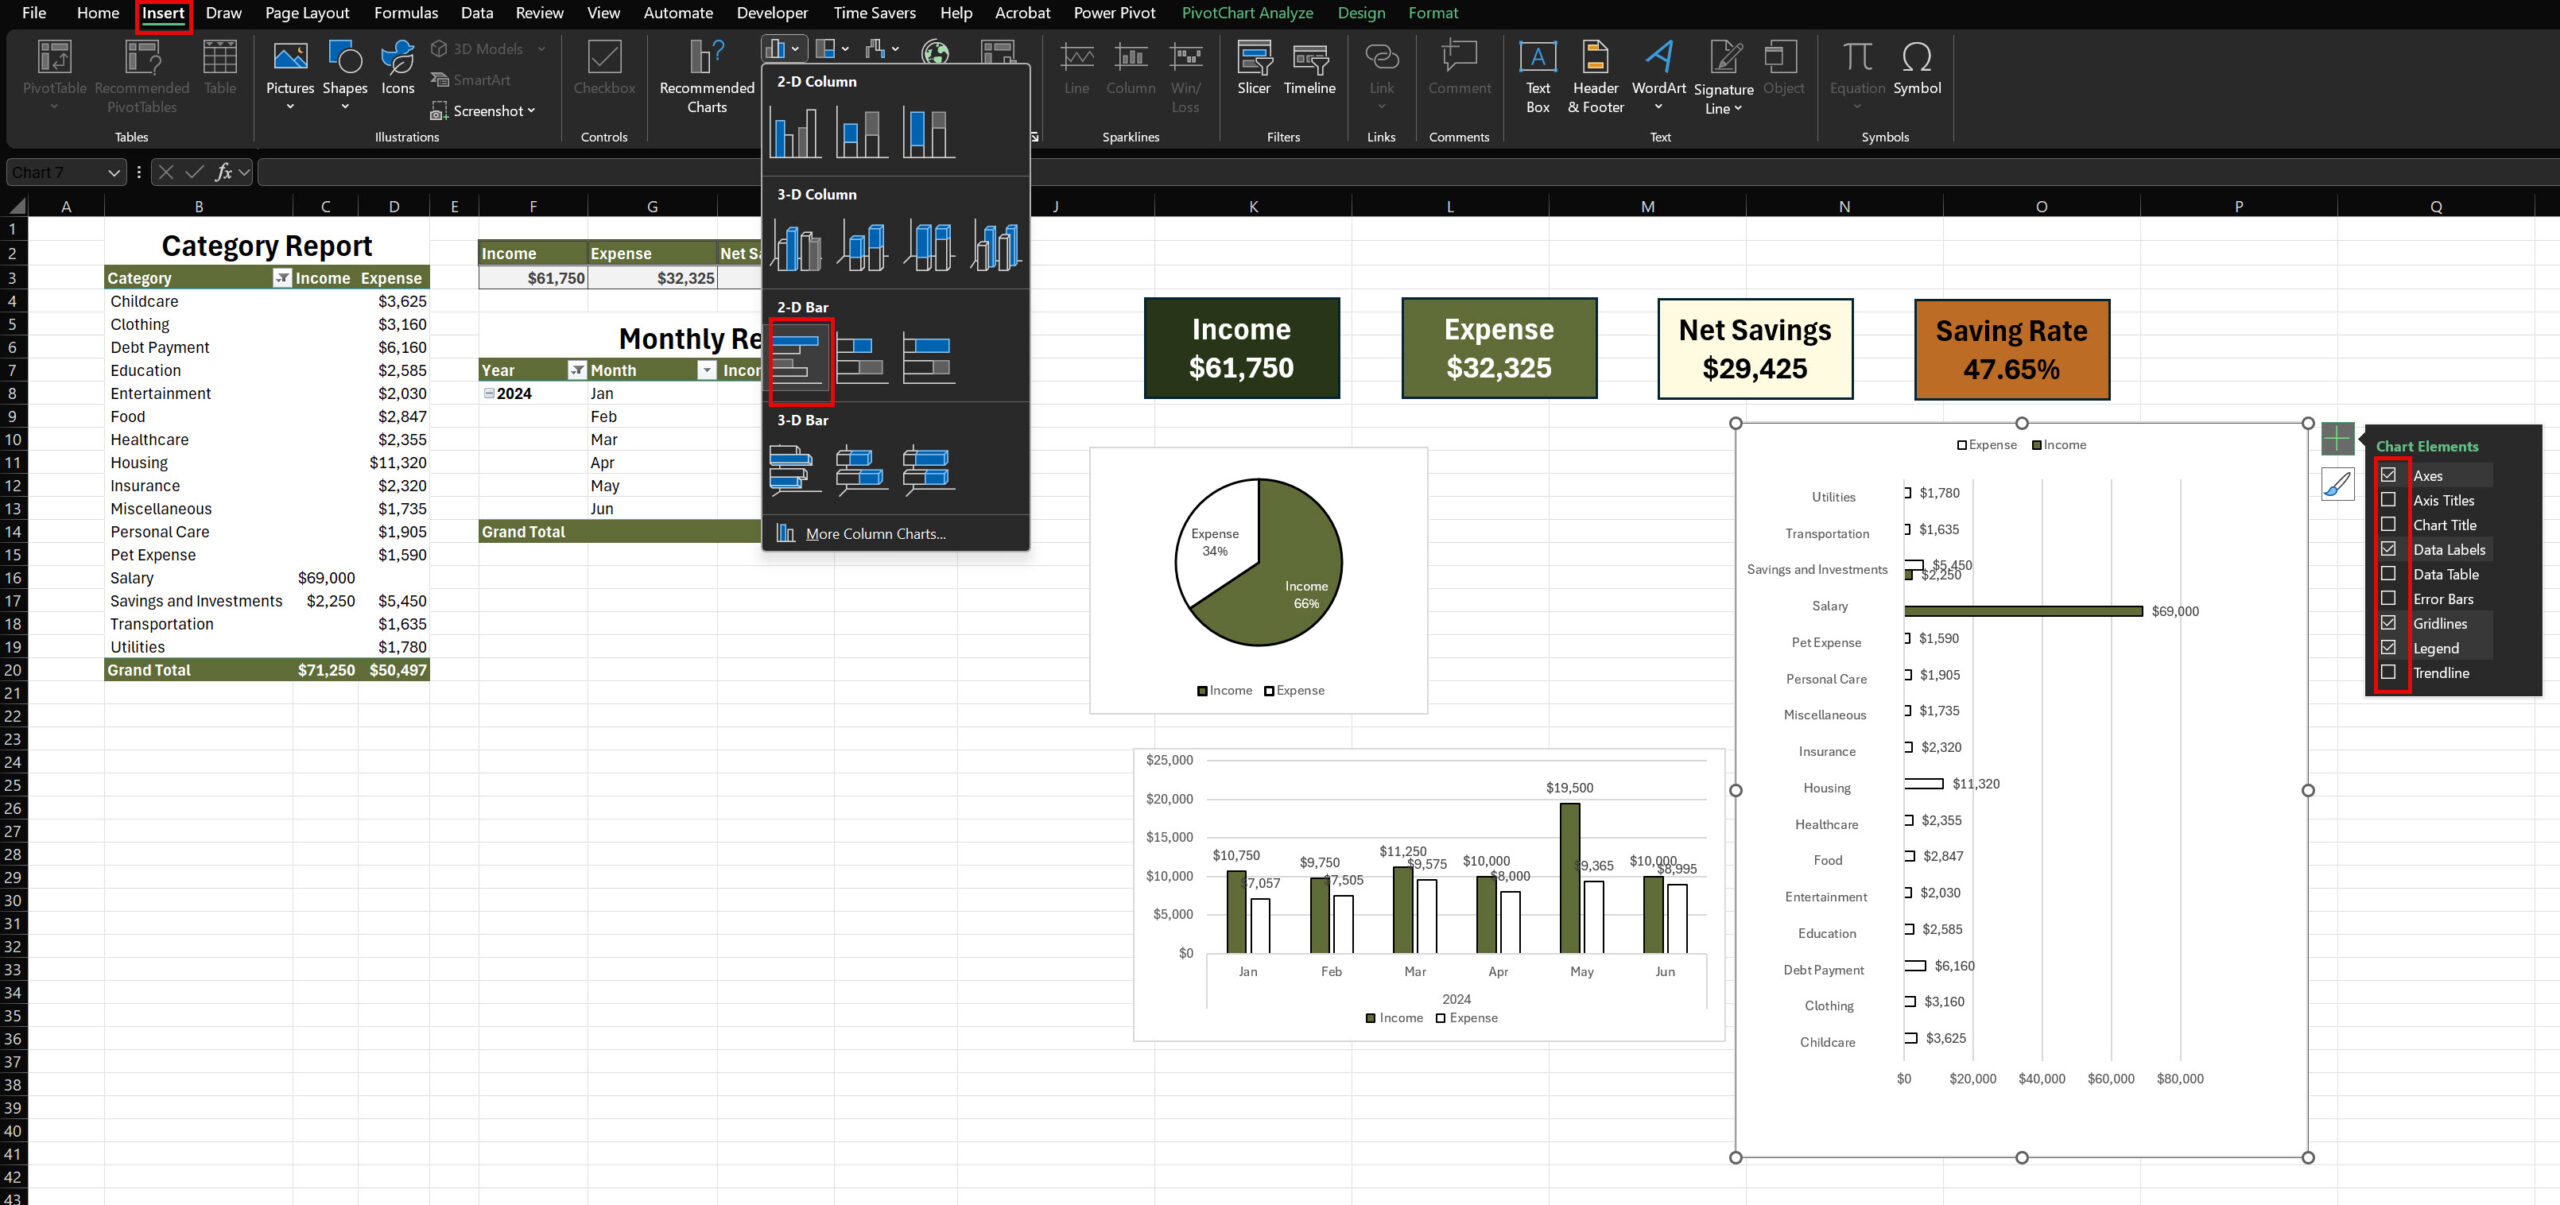
3. Category Bar Chart:
Make your budget tracker more dynamic with slicers:
Slicers allow you to quickly filter your data, making it easy to focus on specific time periods or expense categories.
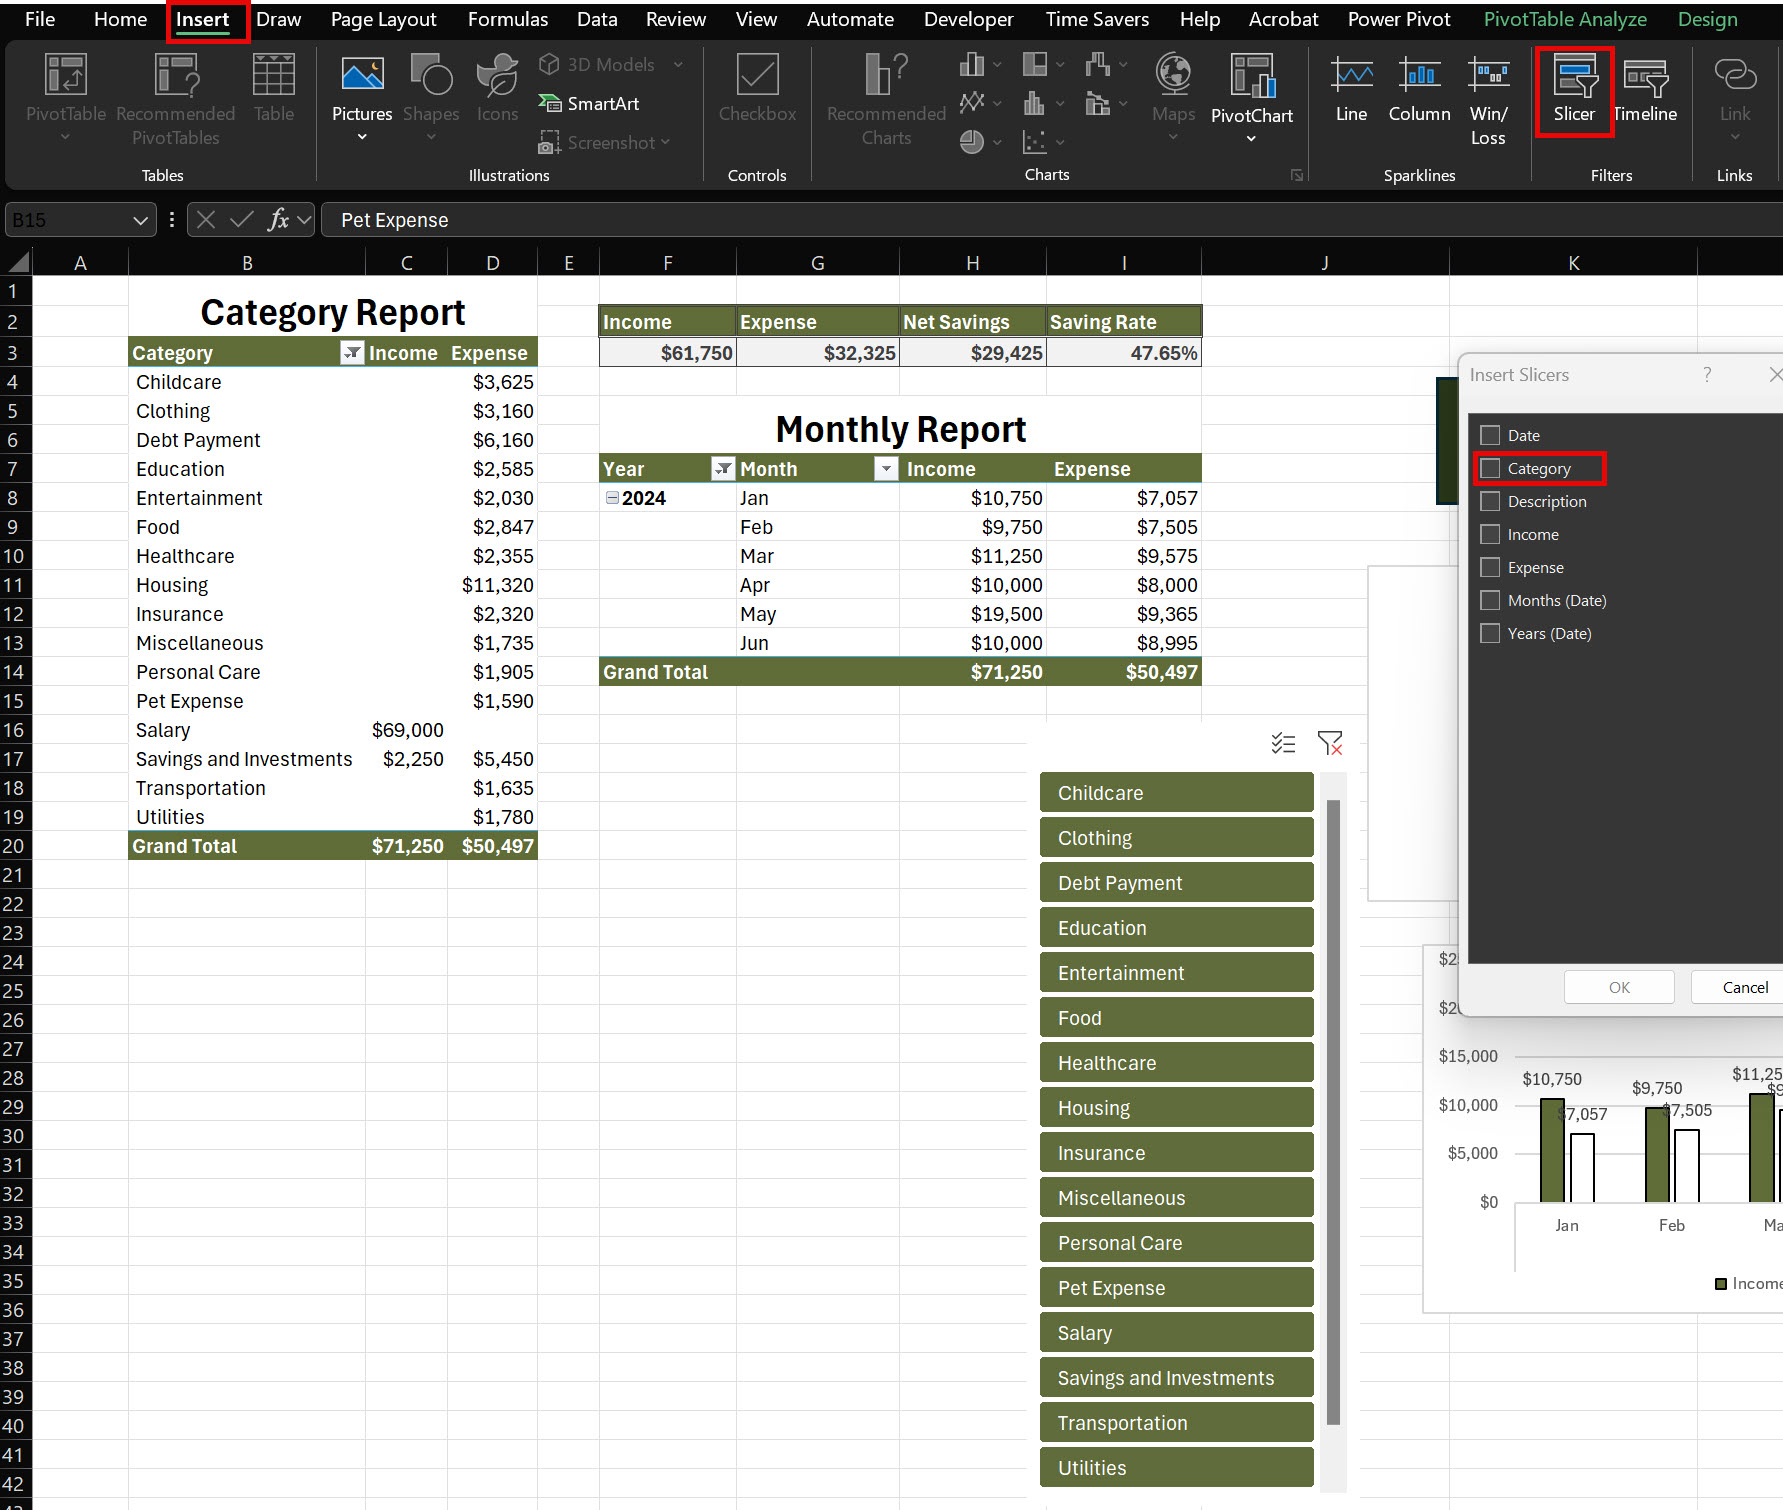
Click anywhere in the PivotTable
Go to Insert > Slicer
Select Category > Press OK.
Position these slicers next to the PivotTable
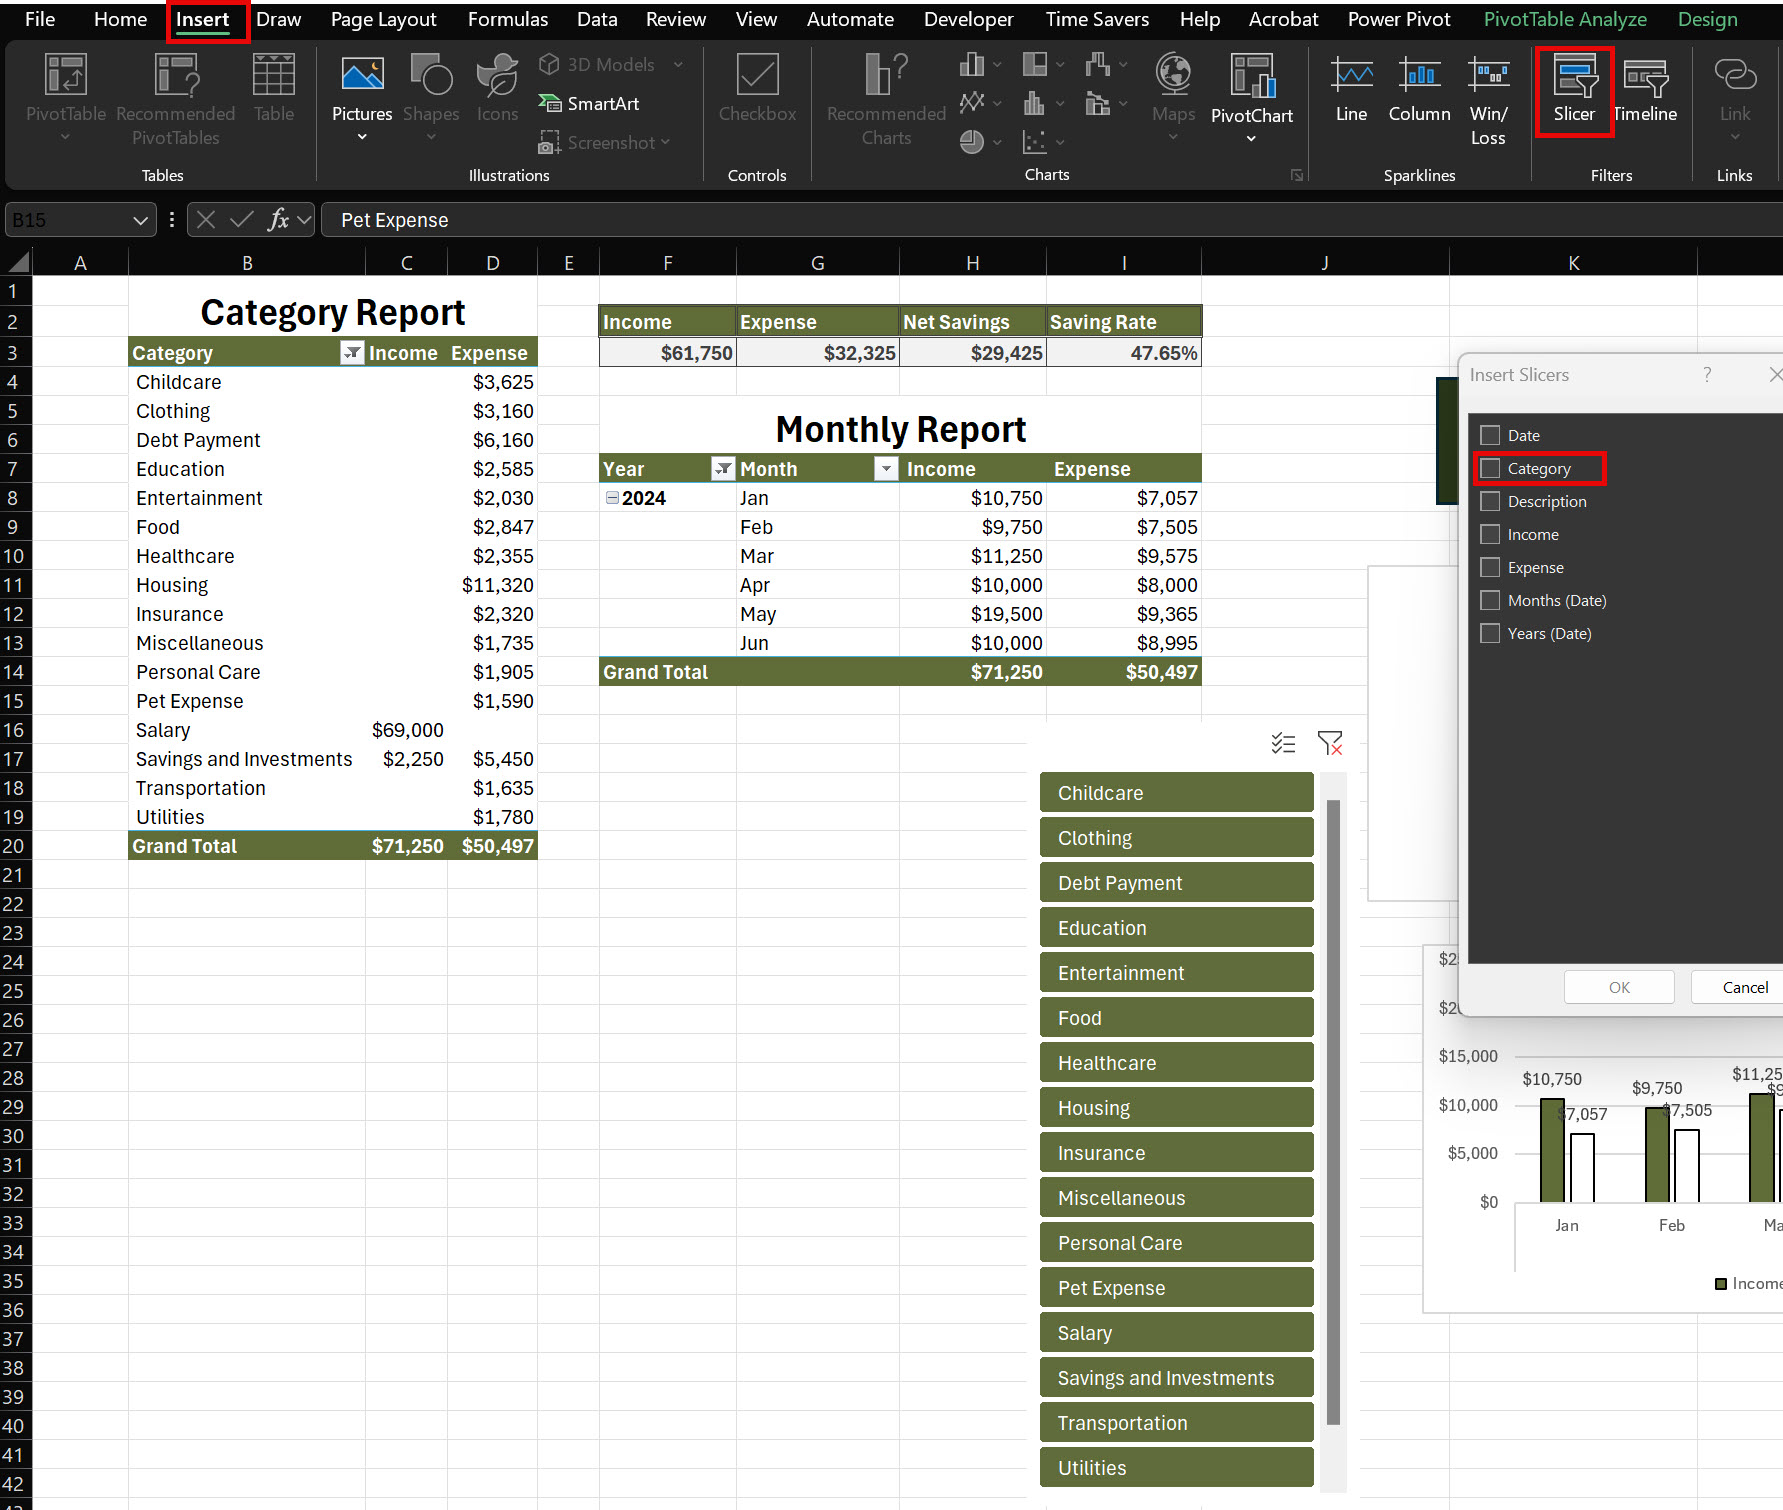
Select the Slicer > Go to Slicer > Go to Report Connection > Select Pivot Table > Press OK.
This will connect all Pivot Table and Pivot Chart when you use the slicer.
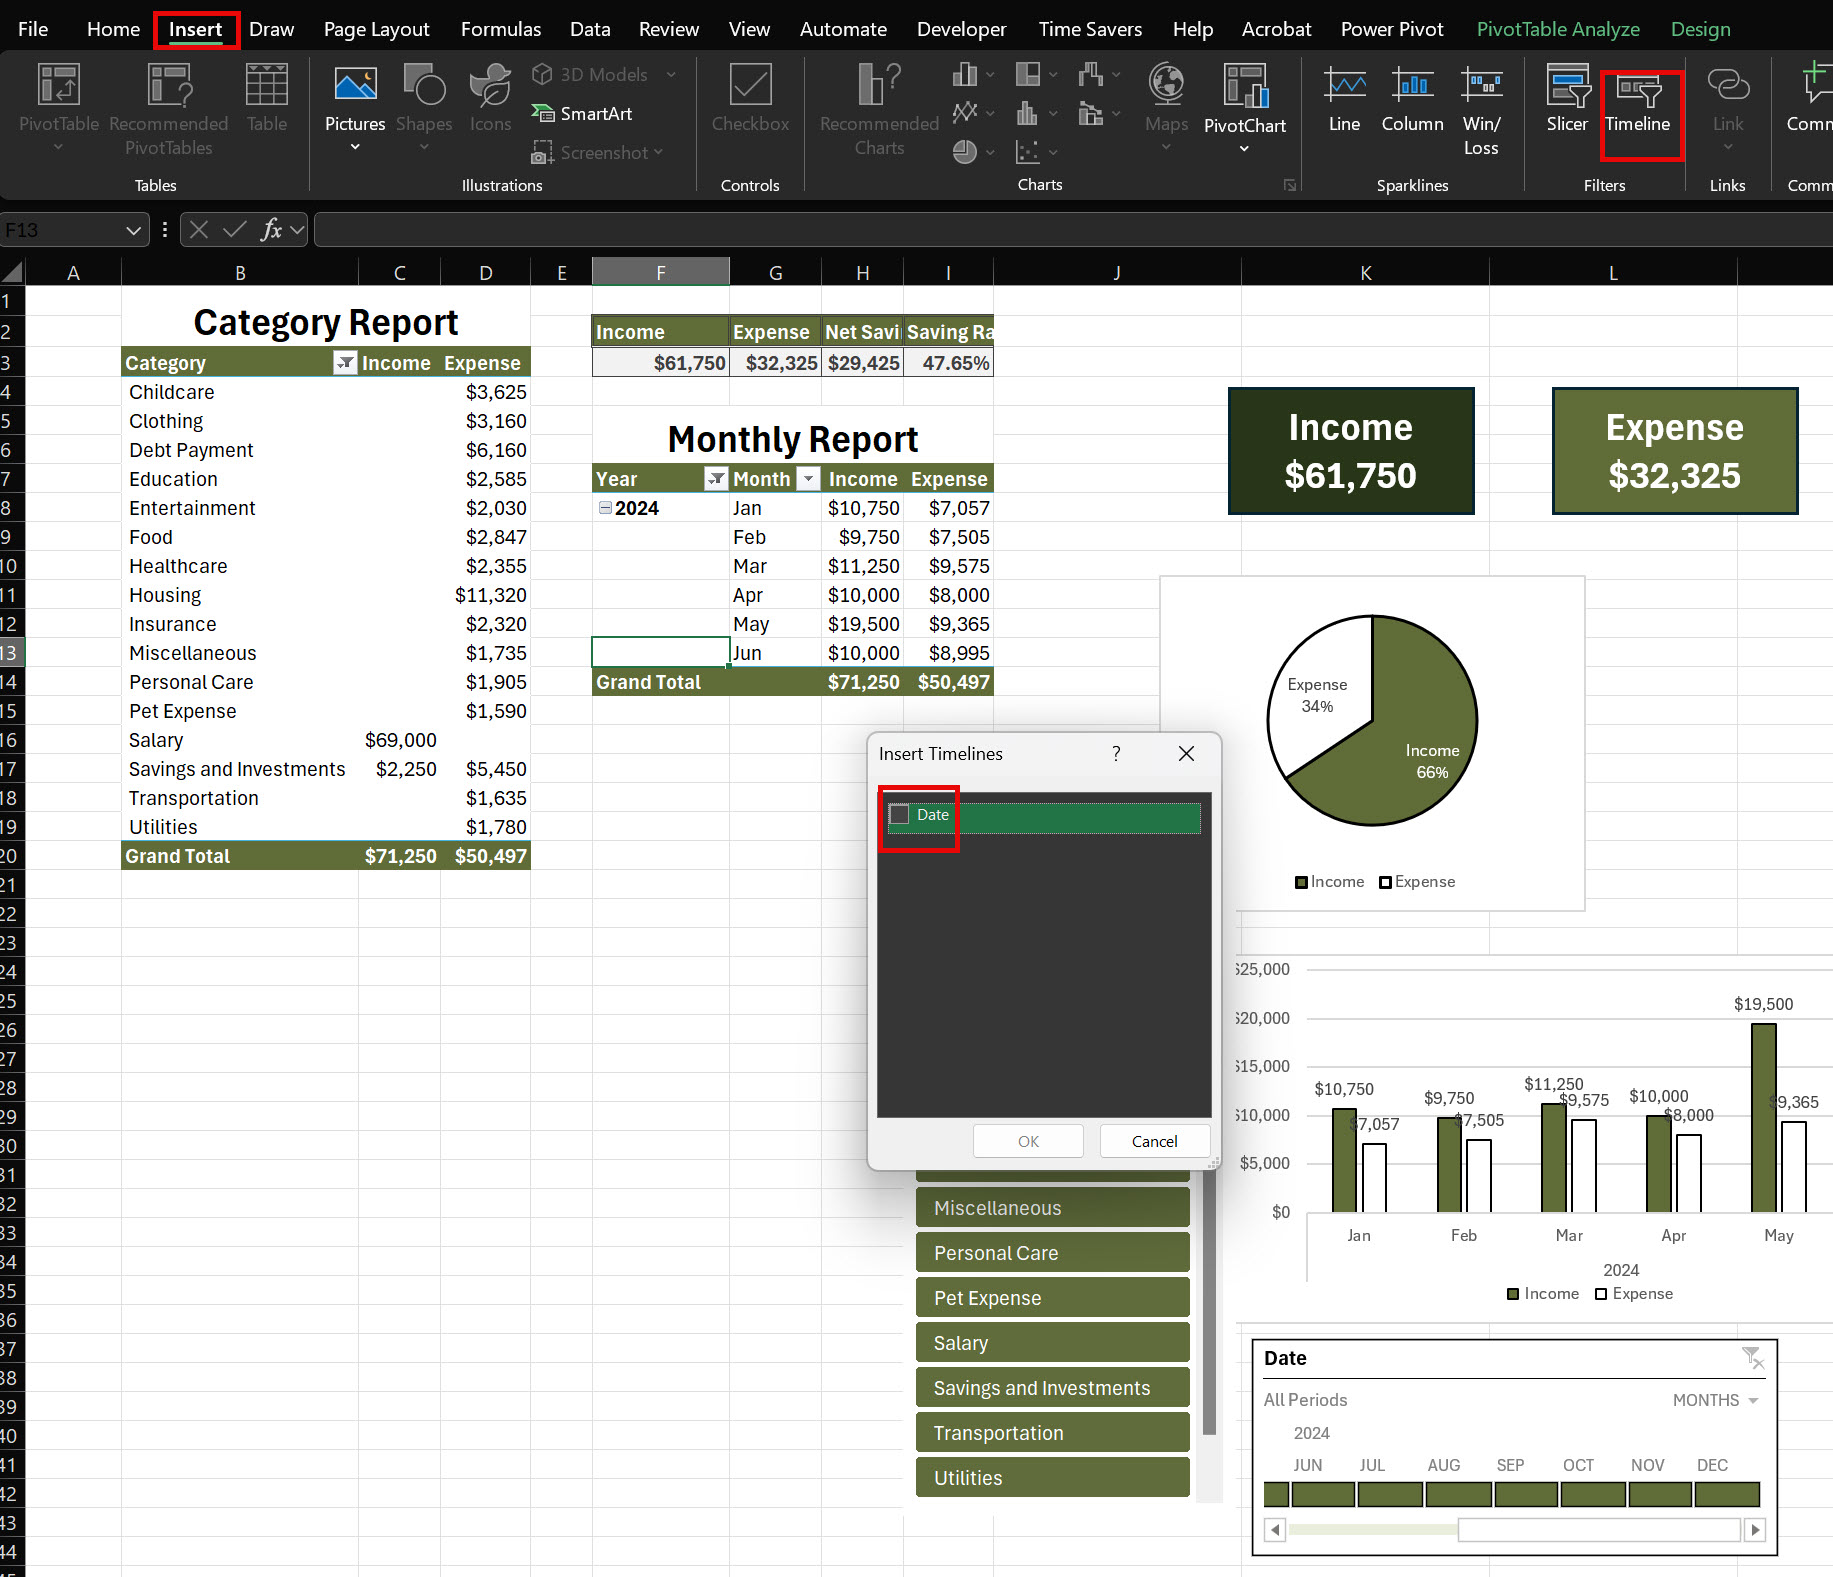
Now, let’s add a Timeline slicer.
Click anywhere in the PivotTable
Go to Insert > Timeline Slicer
“Date” (for months)
Position these slicers next to the PivotTable
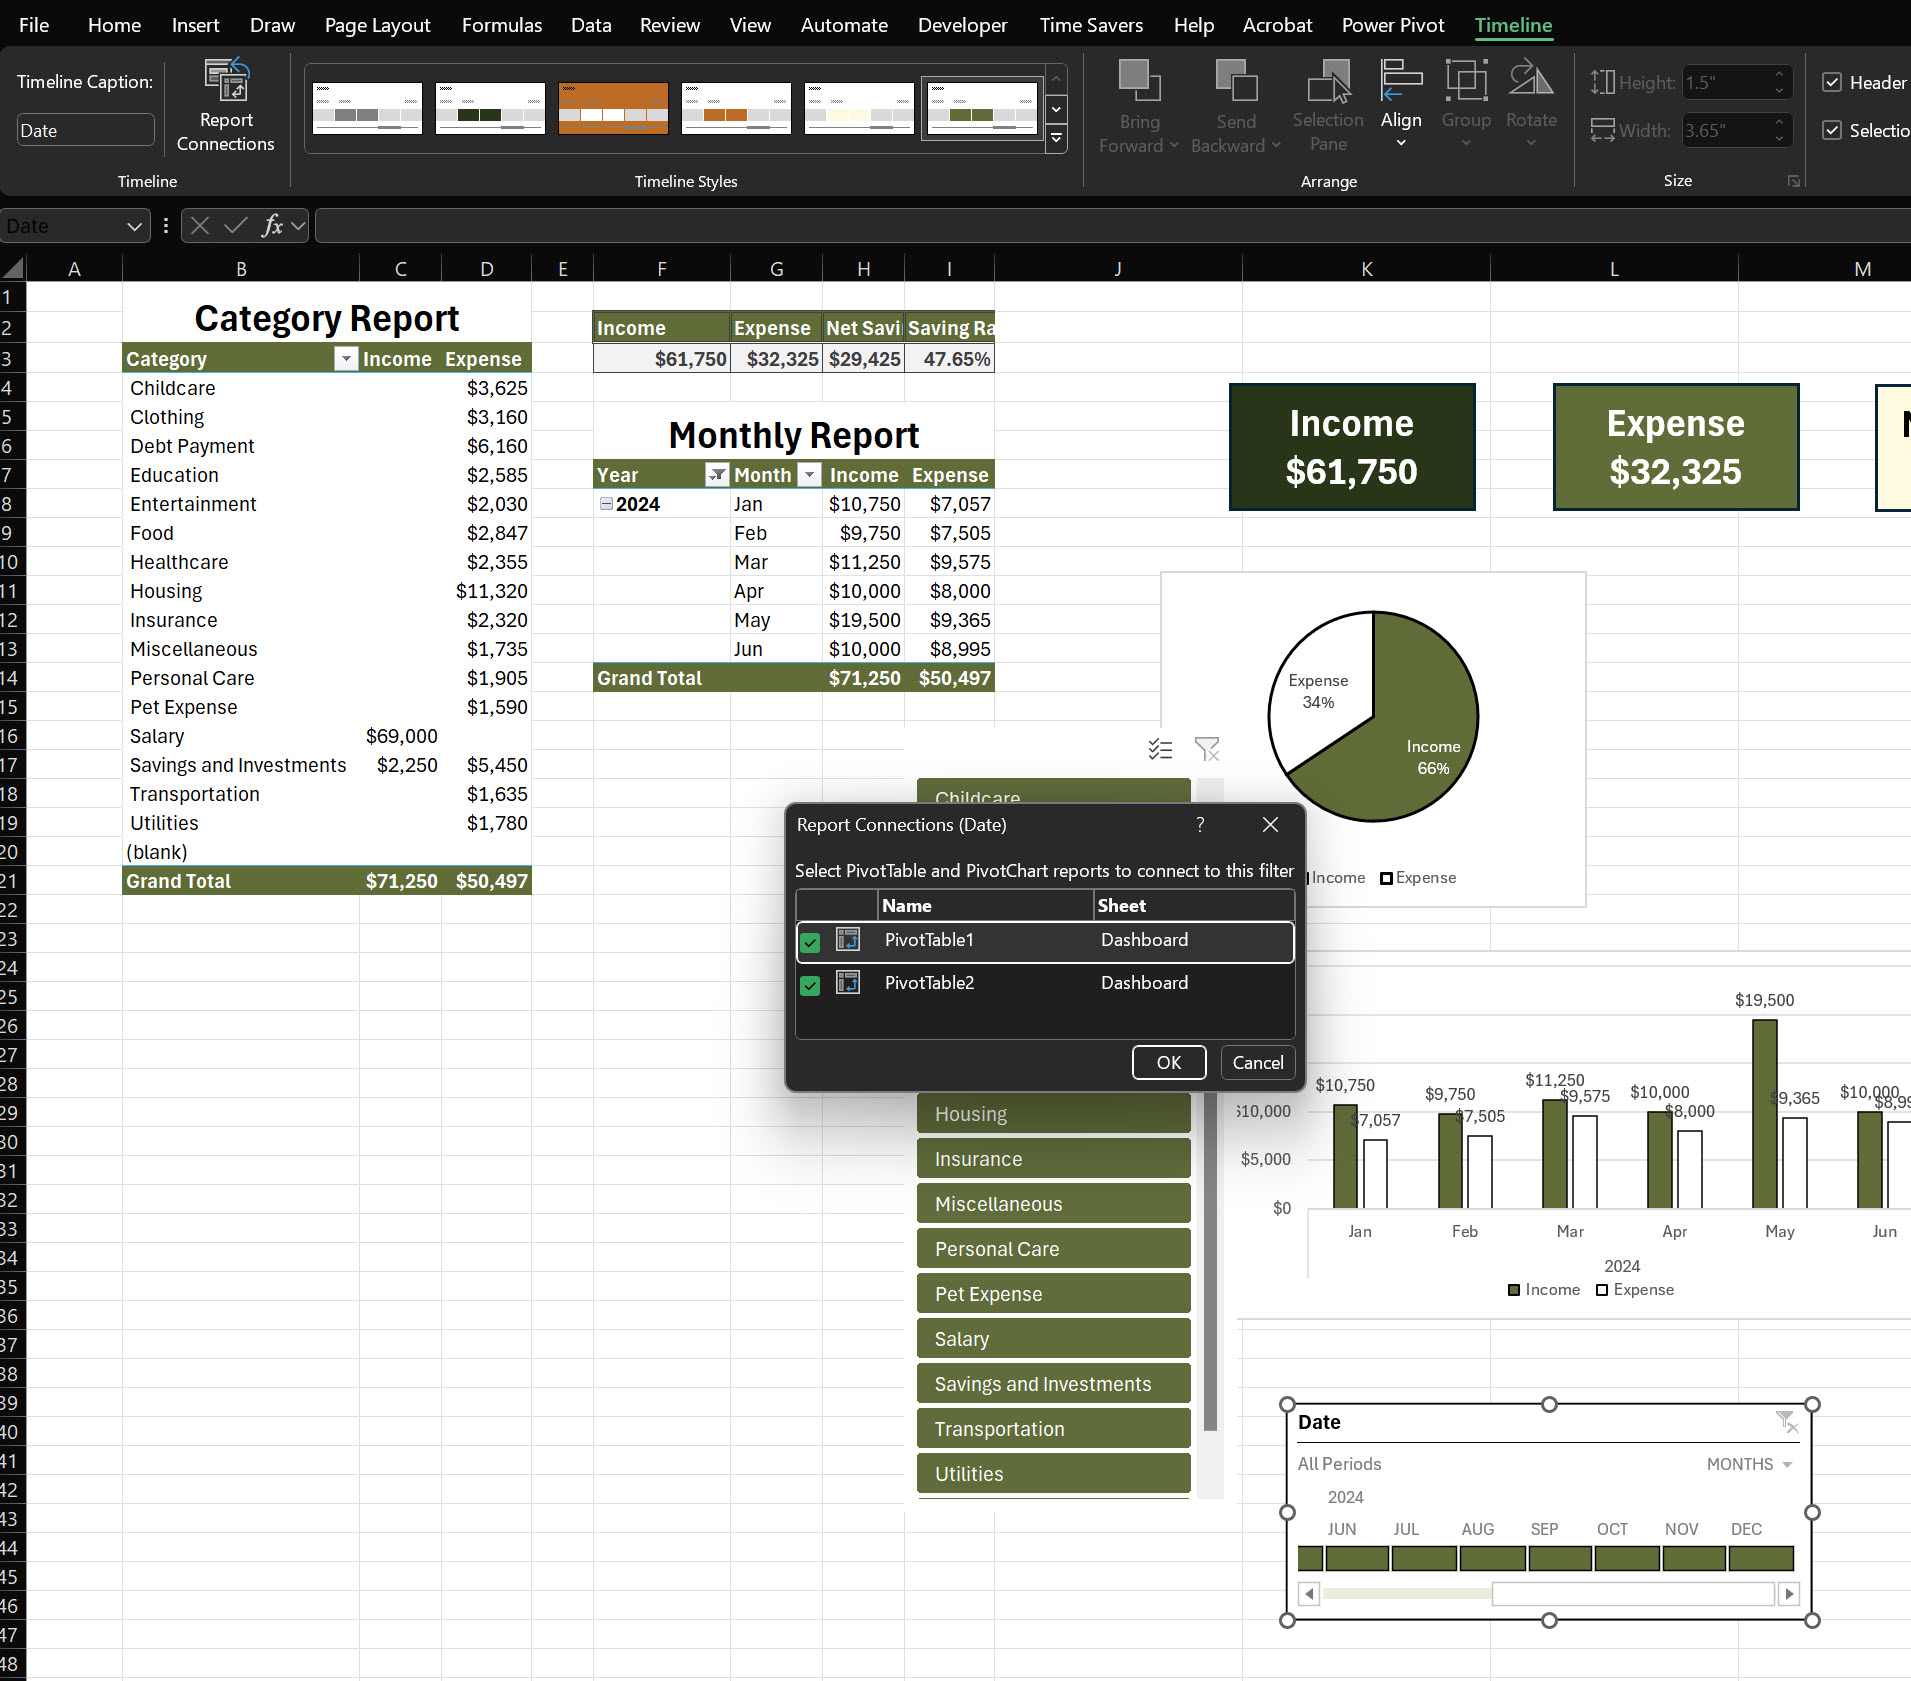
Select the Timeline Slicer > Go to Timeline Slicer > Go to Report Connection > Select Pivot Table > Press OK.
This will connect all Pivot Table and Pivot Chart when you use the timeline slicer.
Add the title “Budget Dashboard” and make it center-aligned with font size 18. Arrange all the components of the dashboard in below manner.
Your dashboard is ready.
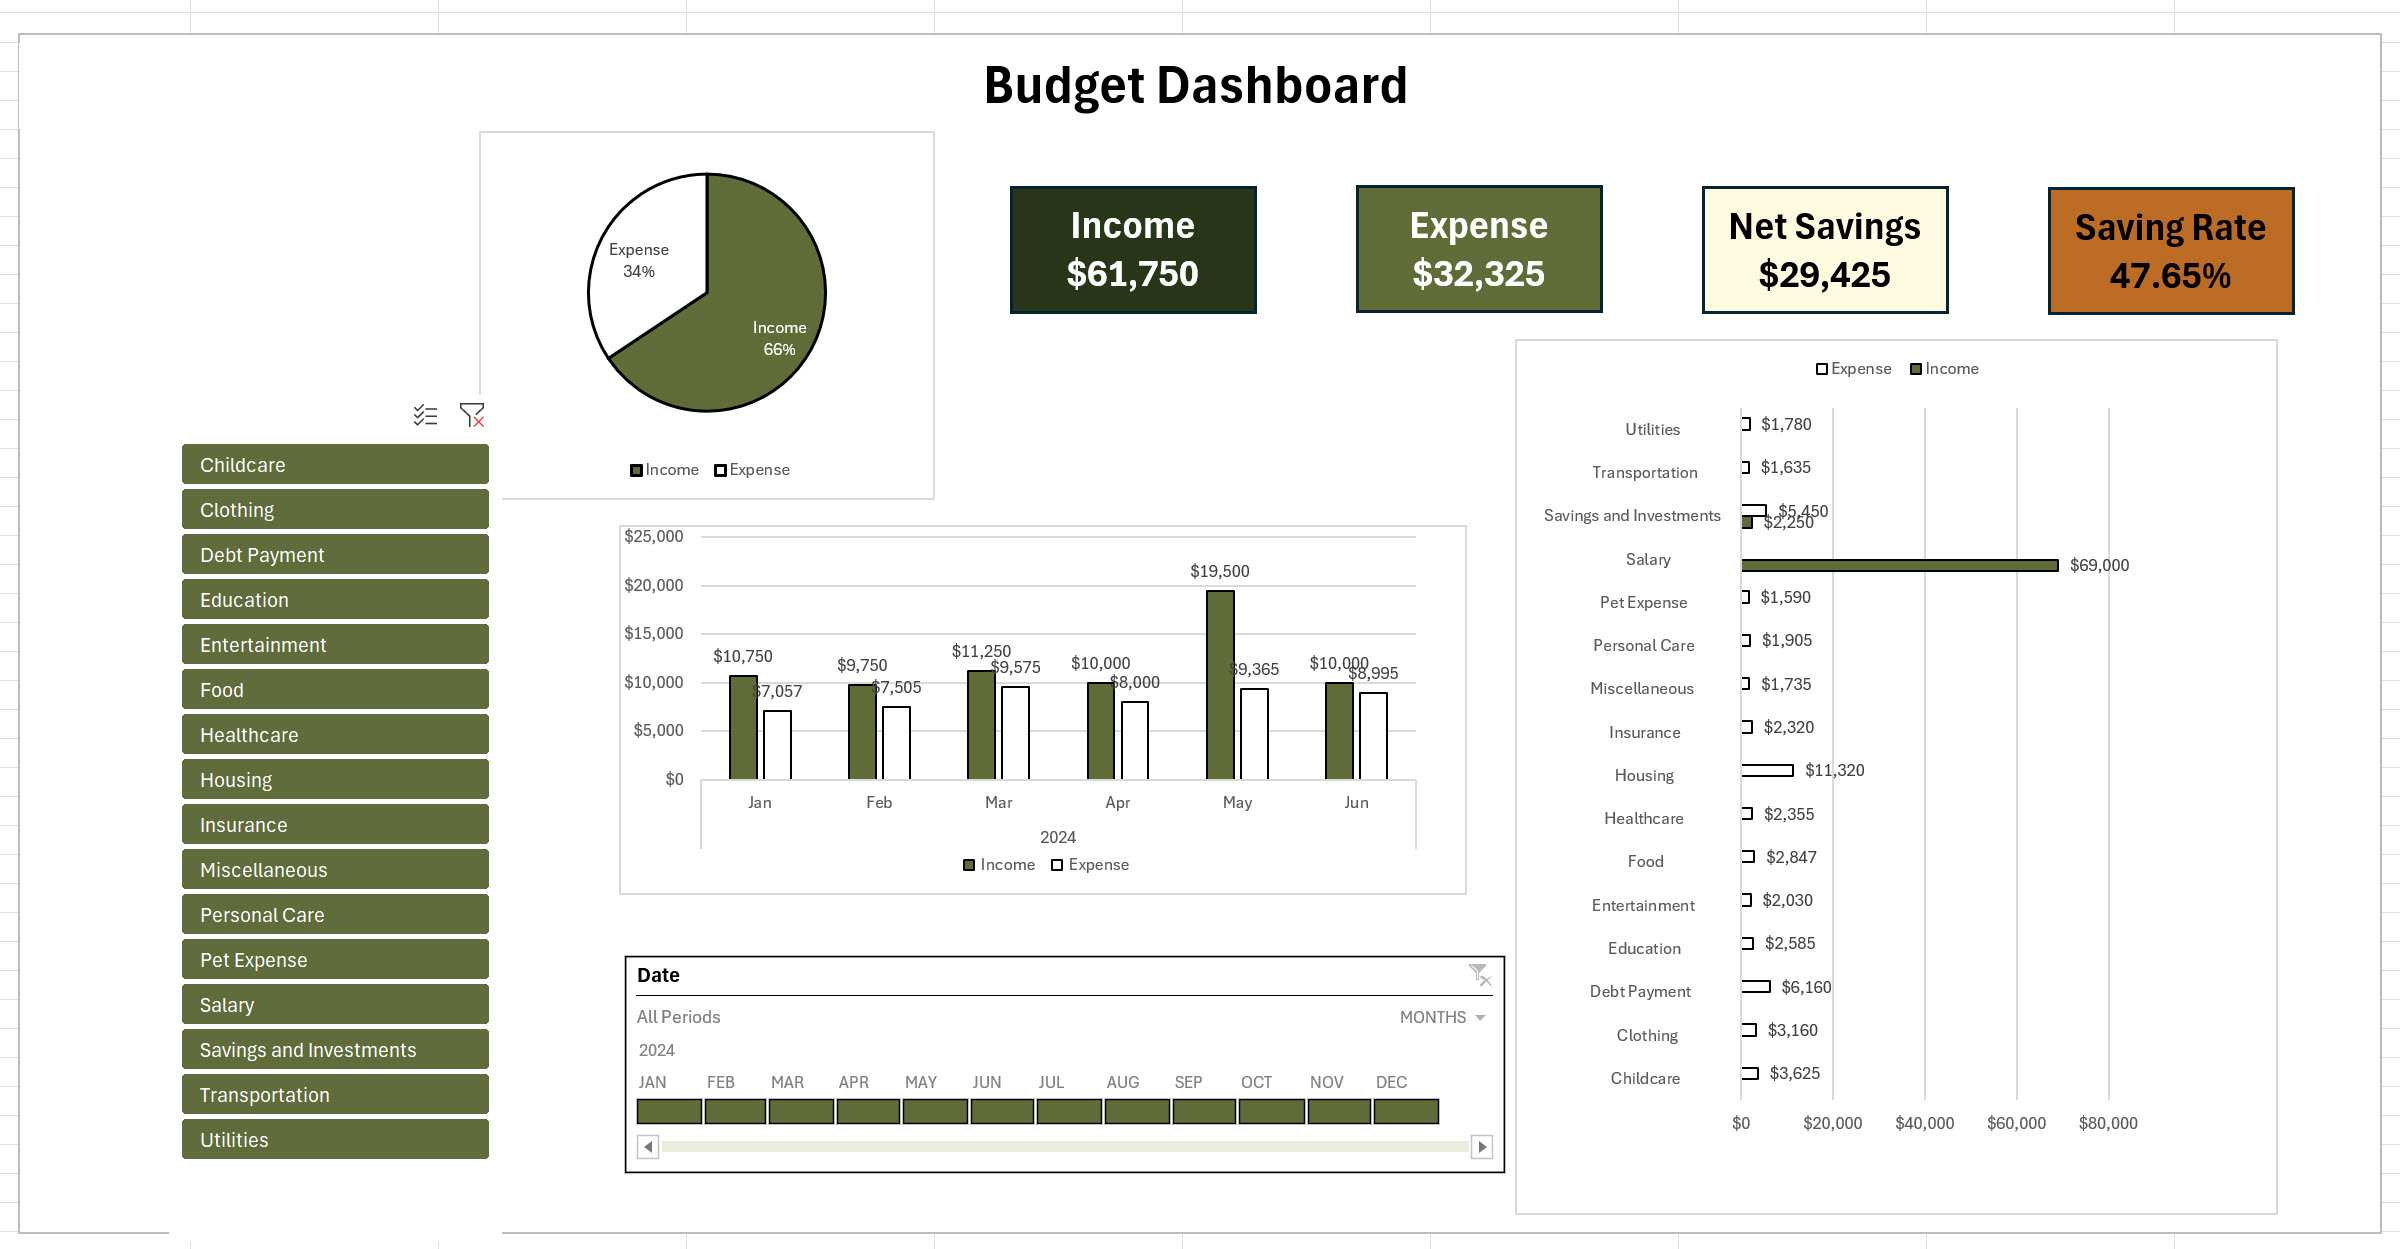
Creating a budget tracker in Excel is straightforward:
Start with a new spreadsheet.
Create columns for categories like “Date,” “Income,” “Expense,” “Category,” and “Balance.”
Use formulas to calculate totals and running balances.
Add a summary section to track monthly totals and compare against budget goals.
Use conditional formatting to highlight overspending.
Pro Tip: Utilize Excel’s table feature (Ctrl + T) to automatically expand your tracker as you add new entries.
To effectively monitor your budget in Excel:
Regularly update your tracker with new income and expenses.
Use pivot tables to summarize data by category or time period.
Create charts to visualize spending patterns.
Set up conditional formatting to flag when you’re approaching or exceeding budget limits.
Use Excel’s data validation feature to ensure consistent data entry.
Remember: Consistency is key. Set a regular schedule to update and review your budget.
Yes, Excel offers several budget templates:
Go to File > New.
Search for “budget” in the template search bar.
Choose from options like “Personal monthly budget,” “Family budget,” or “Business expense budget.”
These templates provide a great starting point, which you can customize to fit your specific needs.
To create an expense tracker in Excel:
Set up columns for Date, Description, Amount, Category, and Payment Method.
Use data validation for categories to ensure consistency.
Implement formulas to calculate daily, weekly, or monthly totals.
Create a pivot table to summarize expenses by category or time period.
Add charts to visualize your spending patterns.
Bonus Tip: Use Excel’s mobile app to log expenses on the go, syncing with your main spreadsheet.
Excel is an excellent tool for tracking expenses because:
It’s highly customizable to fit your specific needs.
Powerful formulas and functions automate calculations.
Data visualization tools help you understand spending patterns.
It’s widely available and compatible with many other financial tools.
Advanced features like pivot tables and macros offer deep analysis capabilities.
However, for some users, dedicated budgeting apps might be more user-friendly, especially for mobile use.
To create any type of tracker in Excel:
Define what you want to track (e.g., expenses, habits, project tasks).
Set up appropriate columns (e.g., Date, Item, Category, Status).
Use data validation to create drop-down lists for consistent data entry.
Implement formulas to calculate totals or track progress.
Add conditional formatting to highlight important information.
Create charts or pivot tables to visualize your data.
Budget templates help you organize and track your income and expenses effectively, ensuring you stay on top of your financial goals.
By using Excel’s features like PivotTables, you can create a dynamic monthly budget to monitor income and expenses, providing real-time insights into your spending.
A personal budget template in Excel simplifies tracking of income, expenses, and savings, making it easier to control personal finances.
A household budget template helps families track joint expenses and income, enabling better planning for savings and essential expenditures.
Congratulations! You’ve now created a powerful, interactive budget tracker in Excel. This advanced tool allows you to:
Log an entire year’s worth of financial transactions
Generate dynamic summaries using PivotTables
Monitor key financial metrics through intuitive KPIs
Analyze trends with informative charts
Explore your data in depth with interactive elements
By regularly updating your transactions and reviewing your KPIs and charts, you’ll gain valuable insights into your financial habits. This knowledge is the first step towards achieving your financial goals, whether that’s increasing your savings, reducing unnecessary expenses, or planning for major purchases. Creating a sample budget sheet in Excel is a simple way to manage your finances. With an excel budget, you can easily track income, expenses, and savings, and there are various budget sheet formats that suit different needs, such as personal budgets or business expenses. If you’re looking for a spreadsheet budget template, many templates are available online to help you get started, and these templates make it easier to structure your budget properly.
If you’re unsure about how to make an excel budget, the process is straightforward. You can use Excel’s built-in functions to set up your household budget examples excel, or create a custom budget that reflects your monthly expenses. To organize your spending better, setting a monthly expenses format in excel can give you a clear picture of where your money is going.
For those who are unfamiliar with Excel’s budgeting tools, there are guides on how to use excel to make a budget. A simple excel budget template is great for beginners, allowing you to track basic categories like income and expenses. Alternatively, if you’re interested in more advanced tracking, a budget xls or creating a budget spreadsheet excel might be more suitable.
Learning how to make a budget spreadsheet in excel or how to prepare a budget sheet is crucial for financial management, especially for beginners. You can explore budgeting spreadsheets or download pre-made budget spreadsheet excel files to start organizing your finances right away. If you’re wondering how to prepare a budget in excel, there are step-by-step instructions available to guide you through the process. For those starting out, a beginner simple budget worksheet is a good option to begin managing your finances. These are easy-to-use templates designed for people new to budgeting.

92% of students automate workflows, build CEO-ready dashboards, and streamline collaboration in < 1 hour. Don’t miss out!
🎯Master every Office 365 tool like Excel, Word, PowerPoint, Teams, Outlook and OneNote.
🎯Streamlined approach—no fluff, just rapid skill-building.
🎯Eliminate tedious tasks with intelligent automation.
🎯Transform everyday workflows into strategic power moves.
🎯Boost productivity and impress every boss.
🎯Real-World Projects – directly translate lessons into workplace wins.