Learn Excel Dashboard Course in 2 Hours & Get $10K+ Salary Raise
92% of students Craft CEO Ready Dashboard in < 30 minutes. Win now, fast-track promotions (+$10K)
Managers Ignoring Your Charts?
Be the Data Storyteller They Can't Ignore.
Old Way
- My charts confuse stakeholders
- I miss key insights in raw data
- I waste hours formatting
New Way
- Design boardroom-ready visuals
- Spot trends with 1-click dashboards
- Automate styling with templates
Why This Isn’t Just Another Excel Charts & dashboards Course
It’s Your $10K Career Turbocharger

$5K–$10K Salary Boosts
Deliver dashboards that trigger promotions and $10K+ salary boosts

First Dashboard in < 30 Minutes
Start telling your boss: "I saved our team 3 hours a day—on my first try!”

Step-by-Step System
We’ve guided hundreds of busy pros to tangible results—no guesswork, zero fluff.

2 Hours of Learning
Spend less than 2 hours of learning, designed for busy professionals who demand actionable results.
From Raw Data to Executive Dashboard
3-Step excel Visualization accelerator Journey
01
Integration with Other Tools
Build dynamic dashboards with other Excel tools.
- PivotTable Charts
- Conditional Formatting
03
02
Chart Foundation
Turn messy data into clear, actionable visuals.
- Data Visualization Foundation
- Cleaning Data
- Charts Overview
- Advanced Charting Techniques
- Charts Checklist
Dashboard Overview
Deliver executive-ready dashboards that save time and impress stakeholders.
- Dashboard Overview
- Designing Dashbaord
- Build KPI
- Interactivity
- Dashboard Checklist
master Excel Data Storytelling in 13 chapters – Turn Skills into Salary!
01 Introduction to Data Visualization
Learn why data visualization is critical for decision-making.
The Importance of Data Visualization
Utilizing Excel for Data Visualization
02 Understanding Data in Excel
Master data cleaning, formatting, and transformation techniques.
Significance of Comprehending Data
Examining Data Structures
Data Cleaning Methods
Formatting Data in Excel
Transforming Data in Excel
03 Introduction to Charts
Get a complete understanding of chart types and their elements.
Overview of Charts
Creating Charts
Elements of Charts
04 Basic Charts
Learn foundational of Excel charts.
Column Charts
Bar Charts
Line Charts
Pie/Doughnut Charts
XY Scatter Plot Charts
Area Charts
Radar Charts
Stock Charts
Histogram Charts
Pareto Charts
Waterfall Charts
Box & Whisker Charts
Treemap Charts
Map Charts
Recommended Charts
Sparkline Charts
05 Advanced Charting Techniques
Learn advanced methods with complex data representation.
Combo Charts & Secondary Axes
Utilizing Trendlines
06 Best Practices for Building Charts
Follow a professional checklist to ensure your charts.
07 Charts Using PivotTables
Leverage PivotTables to create dynamic charts and visualizations.
08 Charts Using Conditional Formatting
Add dynamic visual elements for deeper insights.
Data Bars
Heat Maps
Icon Sets
09 Introduction to Dashboards
Understand the purpose of dashboards.
Purpose and Importance of Dashboards
Components of an Effective Dashboard
10 Designing Dashboards
Learn principles of dashboard design for maximum impact.
Audience Analysis
Defining Clear Objectives
Layout Planning
11 Building KPIs for Dashboards
Create Key Performance Indicators (KPIs) to track performance metrics
KPI Visualization with Shapes
KPI Creation using SmartArt
12 Interactive Elements for Dashboards
Incorporate interactivity and user-friendly.
Using Slicers
Implementing Form Controls
Adding Hyperlinks
13 Best Practices for Building Dashboards
Conclude with a comprehensive checklist to build dashboard.
Get These AMAZING Bonuses...
When you join the 'Excel Visualization Accelerator' Today
Bonus #1
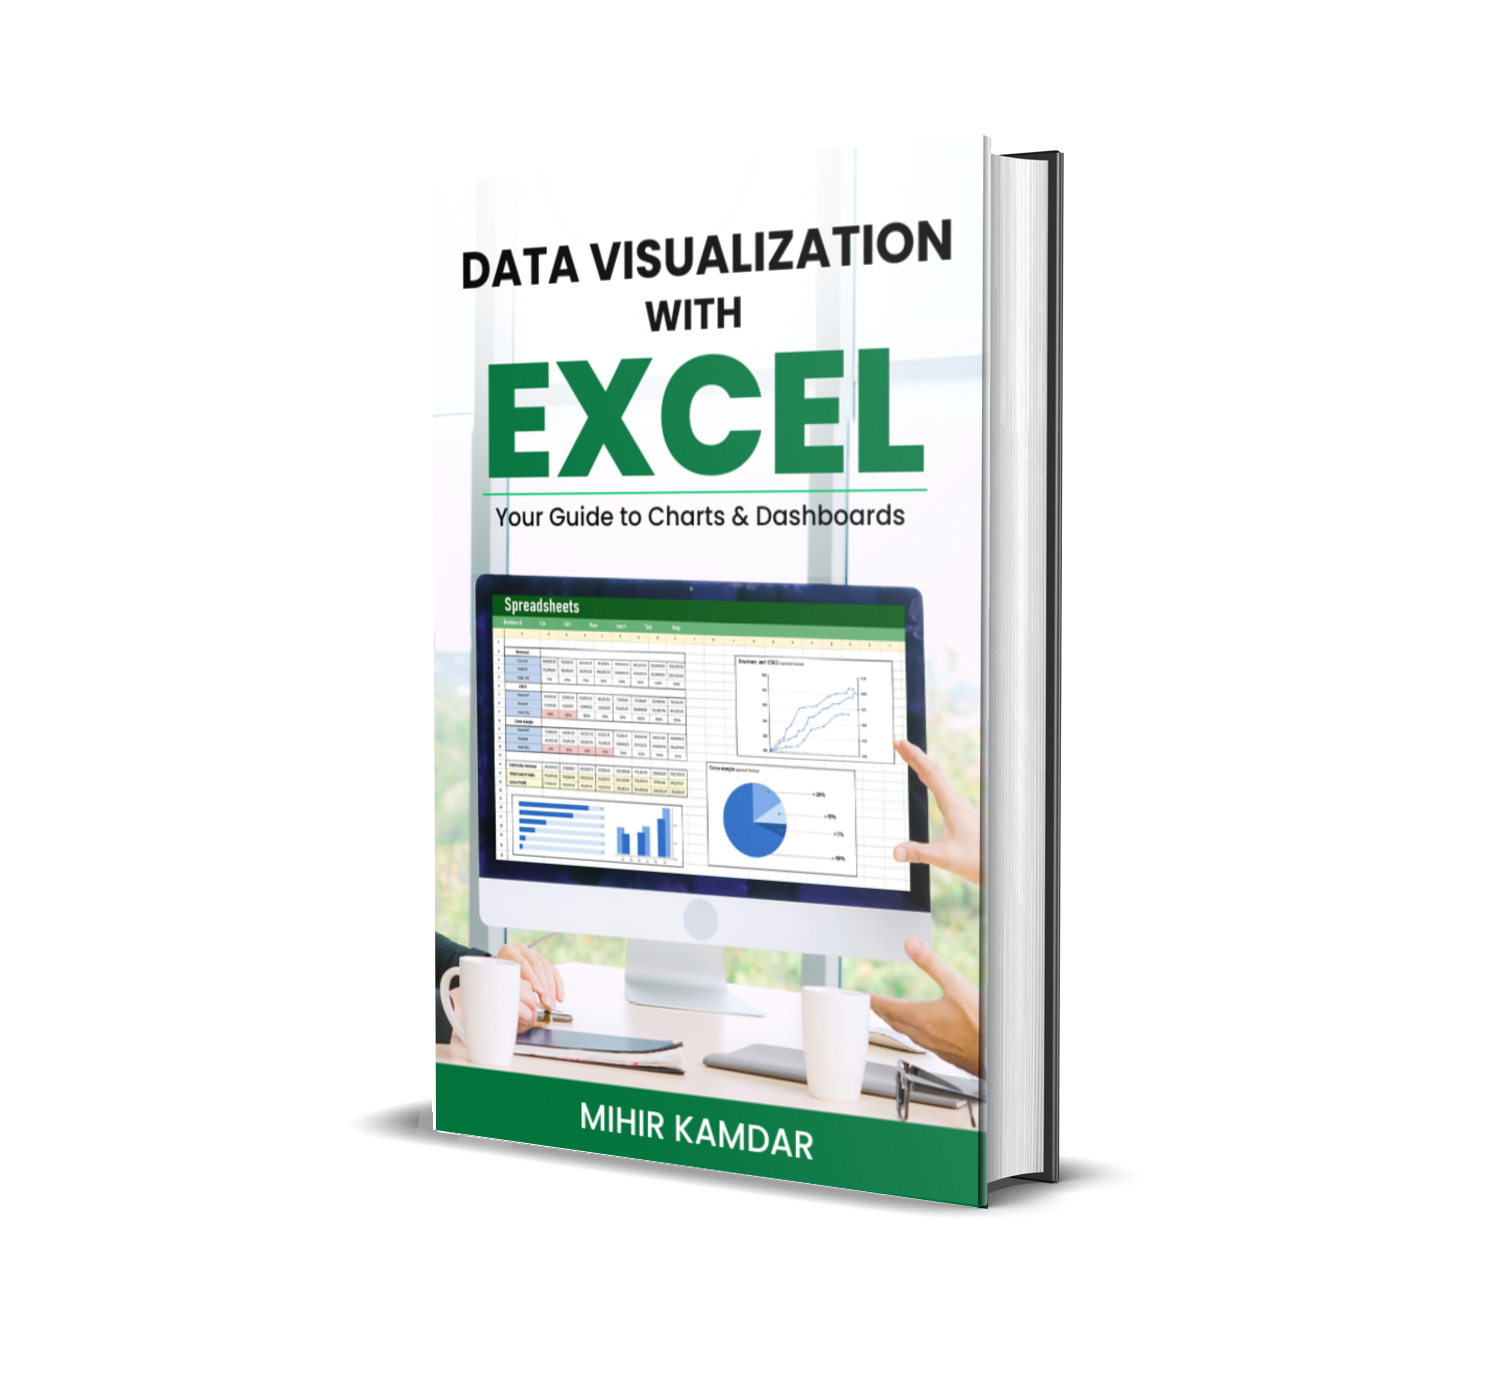

Excel Charts & Dashboards eBook
Never guess a charts or dashboard or best practice again—keep this “forever reference” by your side.
Mirrors the Entire Course
Reinforce each lesson with quick-to-find tips and examples.
Practical Tips & Insights
Stay ahead of the curve—no more random Googling at crunch time.
Lifetime Resource
Print it out or keep it on your desktop—eliminate guesswork forever.
Bonus #2

Excel Charts & Dashboard Real-World Project Video Course
Systematic Approach
Turn messy data into polished dashboards.
Advanced Tools
Power Query, Pivot Table, VBA—learn how pros handle real data challenges.
Project Steps
Data Preparation and Cleaning
Master the initial steps of data analysis, ensuring your data is accurate and ready for deeper insights.
Merge Data Using Power Query
Explore the capabilities of Power Query to unify data sources, honing your data consolidation proficiency.
Interactive Dashboard Elements
Design a dynamic dashboard with engaging features like list boxes and combo boxes for a user-friendly experience.
Chart Creation and Visualization
Leverage PivotTables and PivotCharts to depict data clearly and effectively, enhancing dashboard usability.
Key Performance Indicators (KPIs)
Create and apply KPIs to dynamically monitor important economic metrics.
Macro Implementation with VBA
Boost your dashboard’s functionality with VBA macros, adding automation and advanced control to your data displays.
Framework & Best Practices
Automate and refine your analysis process for flexible, reproducible results that you can easily share with others.
Bonus #3
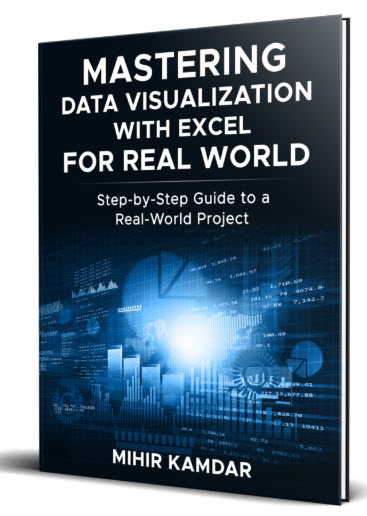

Excel Charts & Dashboard Real-World Project eBook
Step-by-step blueprint for building advanced Excel Charts Dashboards Course—no confusion, no wasted time.
Frameworks, Checklists, Advanced Examples
Confidently replicate high-level workflows.
Perfect Companion
Pair with the Real-World Project Video Course to instantly implement every concept.
Professional Edge
Apply Excel in any setting, from small businesses to corporate giants.
Here's a Recap Of Course +
Everything You'll get fREE

Excel Charts & Dashboards Goodies
- 2+ hours of content packed in 13 chapters, from Excel charts and dashboard fundamentals to advanced storytelling.
- Streamlined approach—no fluff, just rapid skill-building.
- Exercise Workbooks: Hands-on practice that helps you truly absorb each lesson.
- Interactive Quiz: Test your knowledge and reinforce learning to master key concepts.
- Intuitive Online Platform: Focus on learning, not navigating complicated software.
- Practical Projects: Tackle real-world scenarios that translate directly into workplace wins.
- Course Certificate: Showcase your Excel Dashboard proficiency—ideal for resumes or LinkedIn
3 FREE Bonuses
- Excel Charts and Dashboard eBook $50
A permanent reference packed with information, advanced tips, and best practices.
- Real-World Project Video Course $250
An end-to-end excel dashboard online course workflow: data collection, transformation, analysis, and automation.
- Real-World Project eBook $50
A step-by-step blueprint for applying Excel dashboard in any professional setting.
Total Value: $650
🔥 Hurry! Excel Charts & Dashboard Course for $650 $60
- 00Hours
- 00Minutes
- 00Seconds
Hello! I’m Mihir Kamdar
Hello! I’m Mihir Kamdar, an Excel nerd with over a decade of extensive experience across multiple sectors. My goal is to simplify Excel, making it user-friendly and accessible for everyone.
Having worked with Excel in various roles, I crafted this course to share practical insights and real-world strategies. My experiences are distilled into clear, actionable guidance that empowers students to master Excel.
My Teaching Philosophy
Excel should work FOR you, not the other way around. My job? Turn you from spreadsheet struggler to office hero—fast.
Have Any Questions?
Is this course suitable for complete beginners?
Absolutely! The Excel Charts and Dashboards course is designed for both beginners and advanced users. We start with the basics and gradually build your skills step-by-step, so even if you’re new to Excel, you’ll be creating powerful dashboard and analyzing data like a pro in no time.
How long will it take to complete the course?
The core course takes just 2 hours, with bonus courses and hands-on project bringing your total on-demand training to about 2½ hours.
Can I access the course on multiple devices?
Yes, you can access the course from any device—desktop, tablet, or smartphone—so you can learn anytime, anywhere.
Is there a money-back guarantee?
No, we do not offer a money-back guarantee.
Are there any prerequisites for taking this course?
No prerequisites are needed. This course is designed to take you from an Excel chart beginner to a data visualization pro regardless of your starting point.
Does the course include assignments or quizzes?
Yes, each chapter includes interactive quizzes to test your understanding and reinforce your learning.
Will there be updates to the course content?
We continually refine and improve our training based on student feedback, ensuring you always receive the most up-to-date and effective learning experience possible.
How long can I access the course?
You’ll have full access to the course for 12 months, allowing you to learn at your own pace and revisit lessons anytime within that period.
Who can I contact for support if I have questions while going through the course?
Once you purchase the course, you can ask questions in the course discussion section, and we will be happy to assist you.
How can I provide feedback or review the course?
We value your feedback! Submit your review or suggestions by emailing [email protected].
Every hour you wait costs 10+ hours of wasted effort. 92% of students build CEO-ready dashboards in under 30 minutes.
