Power Up Your Career with Microsoft Office Training
Power Up Your Career with Microsoft Office Training
Ebook excel charts & Dashboards
Discover the Art and Science of Excel Charts and Dashboards

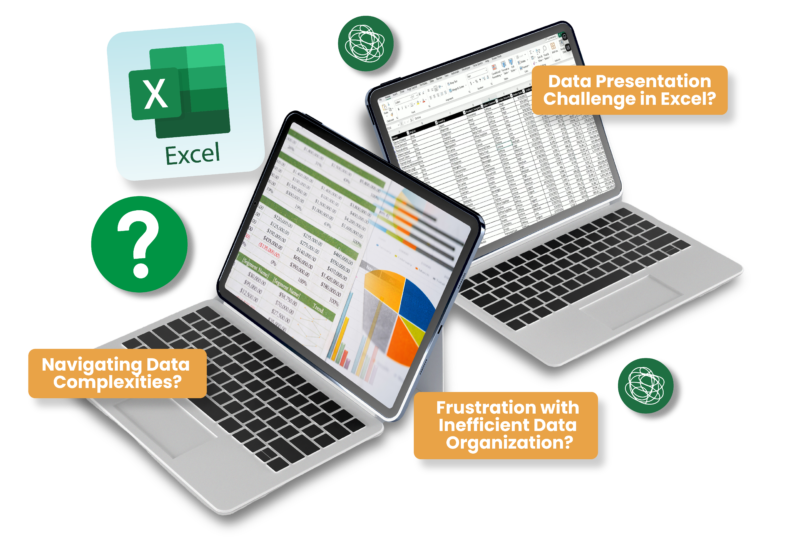
In a world ruled by data, the challenge of effectively presenting it in Excel is widespread. If you struggle to convert complex datasets into compelling visual narratives.
You’re not alone.
This gap between data analysis and impactful visualization can result in misinterpretation and lost opportunities. We firmly believe that everyone should have the ability to craft insightful and persuasive Excel charts and dashboards.
HERE’S WHAT YOU CAN EXPECT
Elevate your Excel visuals from basic to advanced.
Turn real data into clear, actionable visuals.
Master the art of narrative-driven data analysis.
Gain quick-win Excel strategies for immediate use.
Boost your career with sought-after Excel visualization abilities.
‘Data Visualization with Excel: Your Guide to Charts & Dashboards’, is designed to take you from a state of data overwhelm to a place of clarity and confidence. Learn to create charts and graphs that tell a story, driving impactful decisions.
This ebook is your gateway to evolving from a visualization beginner to an expert.
Step into a world where data becomes a powerful narrative tool in your hands, enhancing your professional value and decision-making process.
KEY BENEFITS OF EBOOK COURSE
Our eBook covers a range of topics from basic to advanced visualization. This means you gain a holistic understanding of Excel visualization, ensuring you're well-equipped to tackle any visualization related task with confidence and expertise.
Packed with practical exercises, our eBook encourages active learning. You'll apply concepts directly within Excel, leading to a deeper understanding and retention of skills. This means you're not just reading; you're solidifying your knowledge.
As Excel advances, our eBook keeps pace. Gain access to ongoing updates, ensuring your proficiency aligns with the latest Excel charts and dashboards changes. Stay ahead in your field with the most innovative and advanced Excel visualization skills.
basic to advanced
Explore our table of content designed to take you step-by-step through the essentials to advanced techniques, ensuring you gain the skills and knowledge for real-world application.
1.1. Why is Data Visualization Important?
1.2. Excel as a Data Visualization Tool
2.1. The Importance of Understanding Data
2.2. Examining Data Structure
2.3. Data Cleaning Techniques
2.4. Formatting Data in Excel
2.5. Data Transformation in Excel
3.1. Chart Overview
3.2. Building Chart
3.3. Chart Elements
4.1. Column Chart
4.2. Bar Chart
4.3. Line Chart
4.4. Pie/Doughnut Chart
4.5. XY Scatter Plot Chart
4.6. Area Chart
4.7. Radar Chart
4.8. Stock Chart
4.9. Histogram Chart
4.10. Pareto Chart
4.11. Waterfall Chart
4.12. Box & Whisker Chart
4.13. Treemap Chart
4.14. Map ChartRecommended Chart
4.15. Sparkline Chart
5.1. Combo Chart & Secondary Axis
5.2. Trendlines
Overview – A practical checklist to ensure you follow standards when creating charts.
Overview – Understand how PivotTables can create powerful charts and visualizations.
8.1. Data Bars
8.2. Heat Maps
8.3. Icon Sets
9.1. Purpose of Dashboard
9.2. Elements of an Effective Dashboard
10.1. Understanding the Audience
10.2. Defining Objectives
10.3. Planning the Layout
11.1. KPI via Shapes
11.2. KPI via SmartArt
12.1. Slicers
12.2. Form Controls
12.3. Hyperlinks
Overview – A closing chapter that offers a comprehensive checklist, reinforcing best practices in building dashboards.
POPULAR
office tech skill
Hi! I’m Mihir Kamdar, an Excel enthusiast with a rich background spanning over ten years across various industries. My passion lies in demystifying Excel, making it approachable and user-friendly for all.
My experience with Excel across different jobs has led to this eBook. My real-world experiences and insights are now distilled into practical guidance, offering readers firsthand knowledge and effective strategies to excel in Excel.

Answer at your fingertips
Absolutely! It’s designed to guide you from the very basics to advanced topics.
You’ll start seeing results as soon as you begin applying the concepts. Each chapter is designed to give you quick wins and noticeable improvements in your skills.
Yes, the eBook is formatted to be accessible on various devices, making learning convenient for you.
Unfortunately, there is no refund for this eBook because we are selling it at a discounted price.
No specific prerequisites are needed. The eBook is structured to help readers progress from basic to advanced levels, regardless of their starting point.
Yes, the eBook is packed with practical examples and exercises to help you apply what you learn in real-world scenarios.
Any future updates will be provided free of charge. Registered users will receive notifications and access to download updated versions.
You can reach out to our support team via email or email us at [email protected] for any queries or assistance you may need.
We welcome your feedback! You can submit your review or feedback through email or email us at [email protected].
Contact us and we will answer you as soon as possible
or email us at [email protected]
Purchase now and gain the skills needed to excel in your career.