Become Data Analyst In 30 Hours → Automate 80% Of Work & Land $15K Raise
92% of students Build Dashboard in < 1 hour. Build CEO dashboards, fast-track promotions (+$15K)
Tired of Manually Building Reports
While
Colleagues
Get Promotions
Old Way
- Spending 14+ hours a week manually cleaning data or fixing errors in Excel.
- Missing promotions because you lack advanced Excel or Power BI skills.
- Missed insights due to slow, cumbersome data processing.
New Way
- Automate 80% of your work with Excel formulas, Power Query, and VBA scripts.
- Build stunning, interactive dashboards in Power BI that wow managers and clients.
- Turn raw data into actionable insights that fast-track your career with a $15K raise.
Why This Isn’t Just Another Excel + Power BI Course
It’s Your $15K Career Turbocharger

$5K–$15K Salary Boosts
Build Fortune 500-level skills that make you indispensable in any organization.

First Dashboard in < 1 hour
Start telling your boss: ‘I saved our team 3 hours a day—on my first try!”

Step-by-Step System
We’ve guided hundreds of busy pros to tangible results—no guesswork, zero fluff.

3 Hours/Day for 10 days
Leap ahead of 90% of your peers by dedicating a fraction of your time to master Excel & Power BI.
From Spreadsheet Zero to BI Hero
6-Step Analyst Accelerator Journey
01
Advanced Excel Techniques
Automate Advanced Workflows
- Write VBA scripts to automate workflows and secure sensitive files.
- Use Office Scripts for advanced forecasting and data protection.
03
04
Power BI Data Modeling & Analysis
Build Scalable Models, Reveal Trends
- Build scalable models with DAX to reveal trends instantly.
- Turn complex datasets into actionable insights.
05
Real-World Projects
Build Portfolio-Ready Dashboards for Success
- Apply your skills by building portfolio-ready dashboards that showcase your expertise in both advanced excel and power bi course
02
Excel Foundations
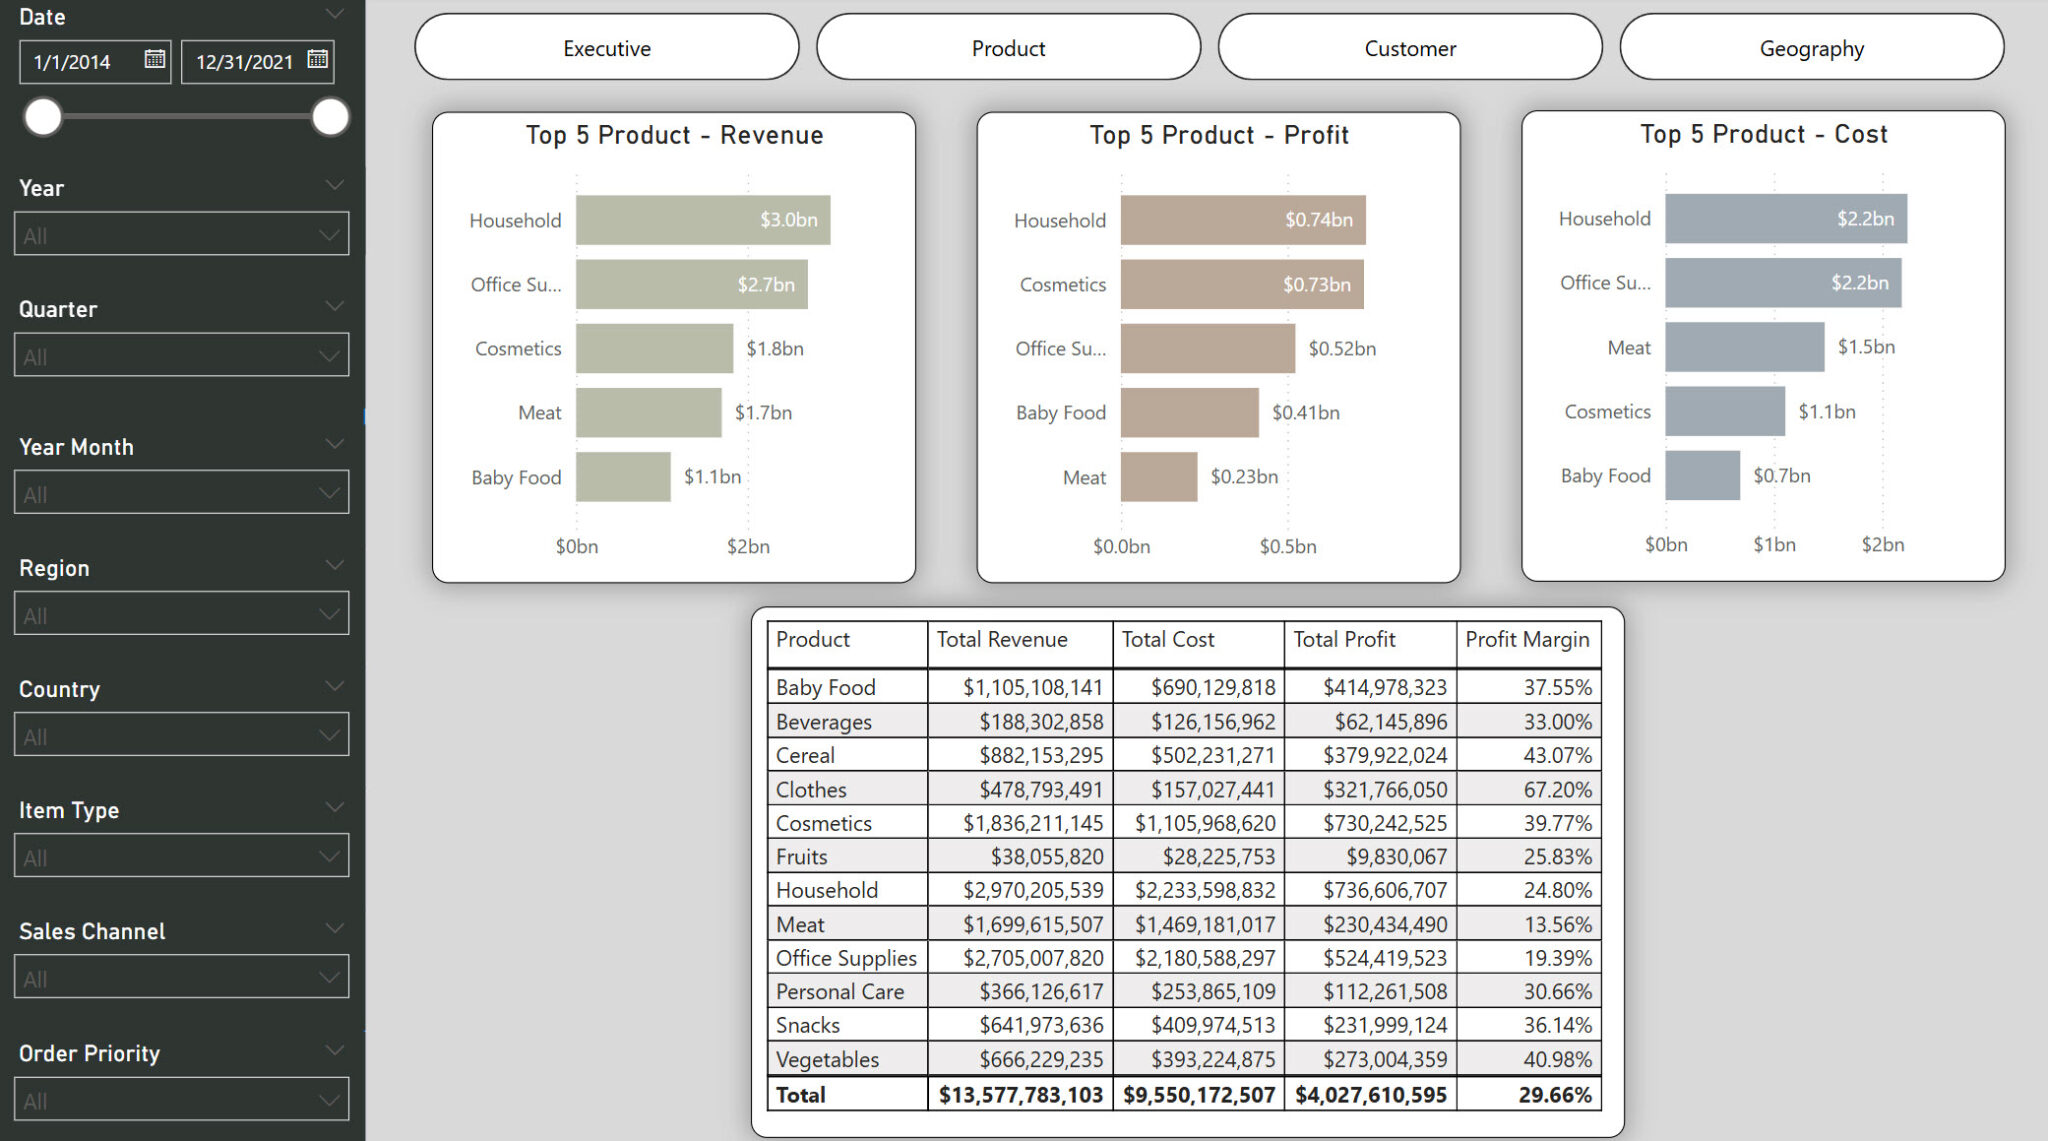
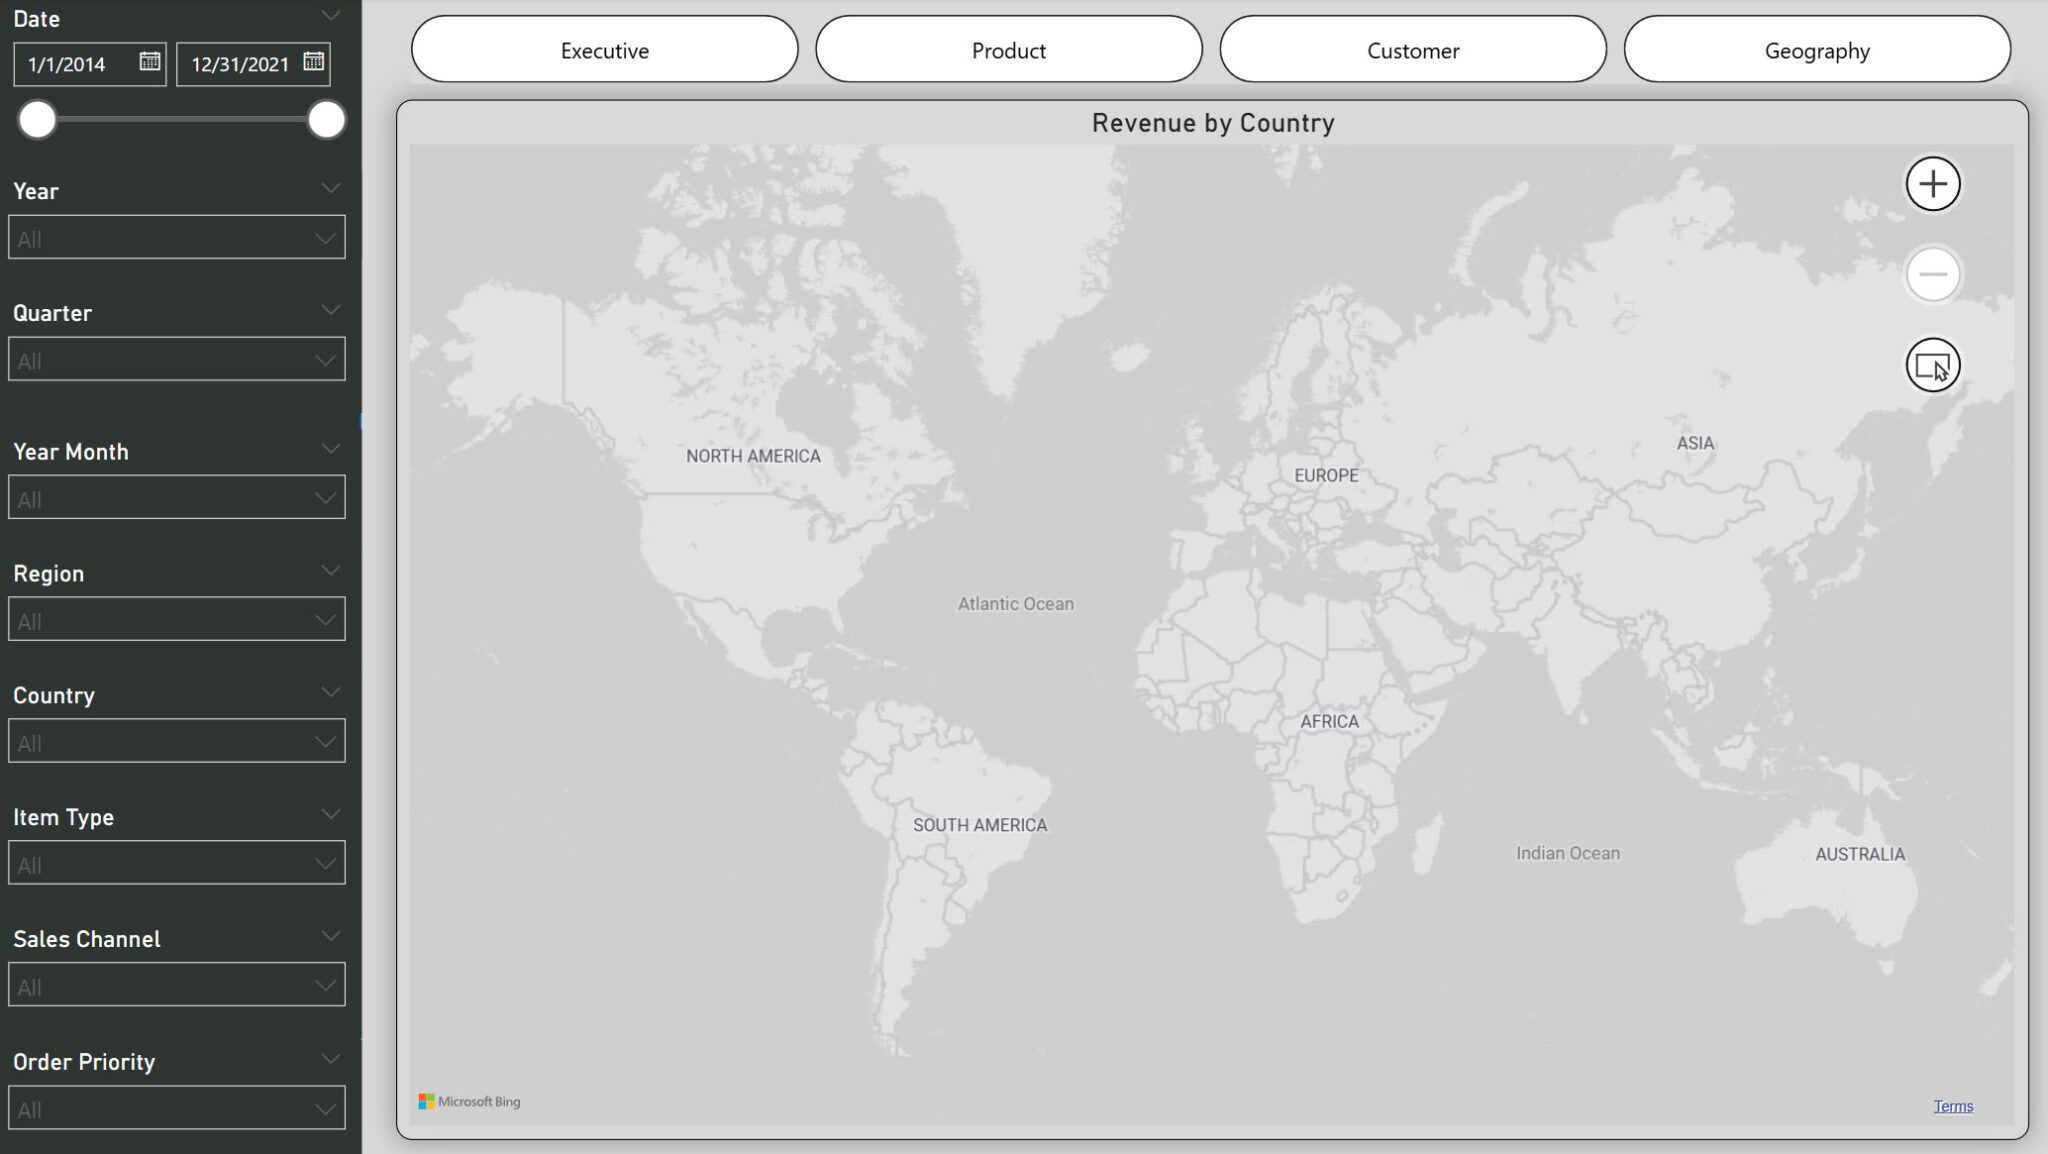
Build Reports, Create Powerful Dashboards
- Automate calculations with formulas, functions, and PivotTables.
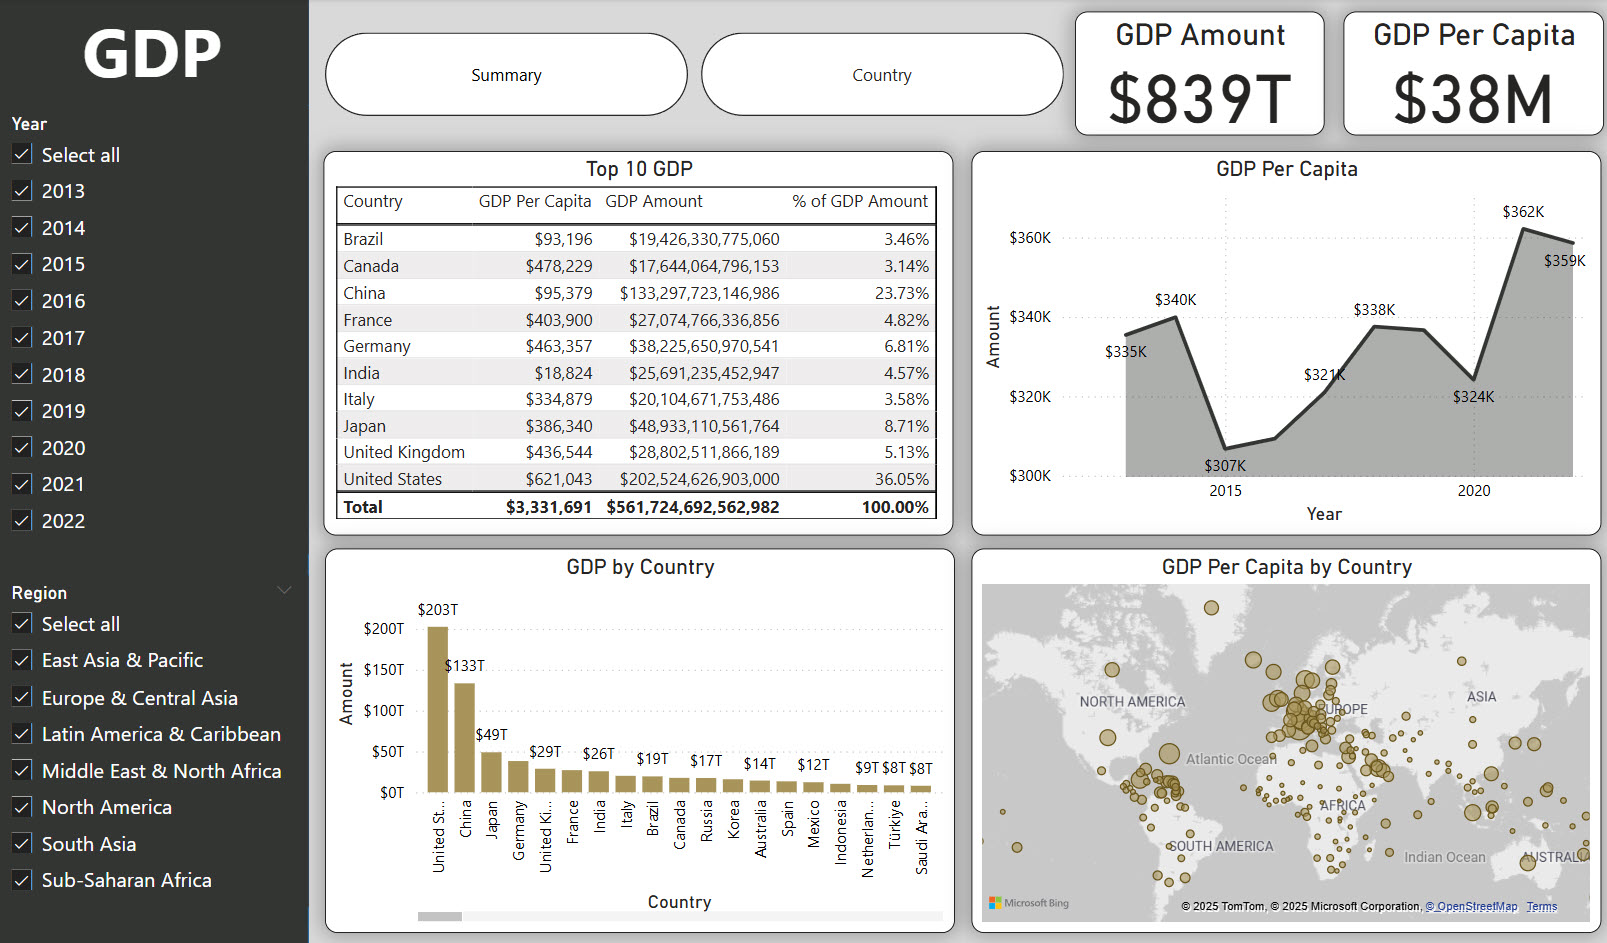
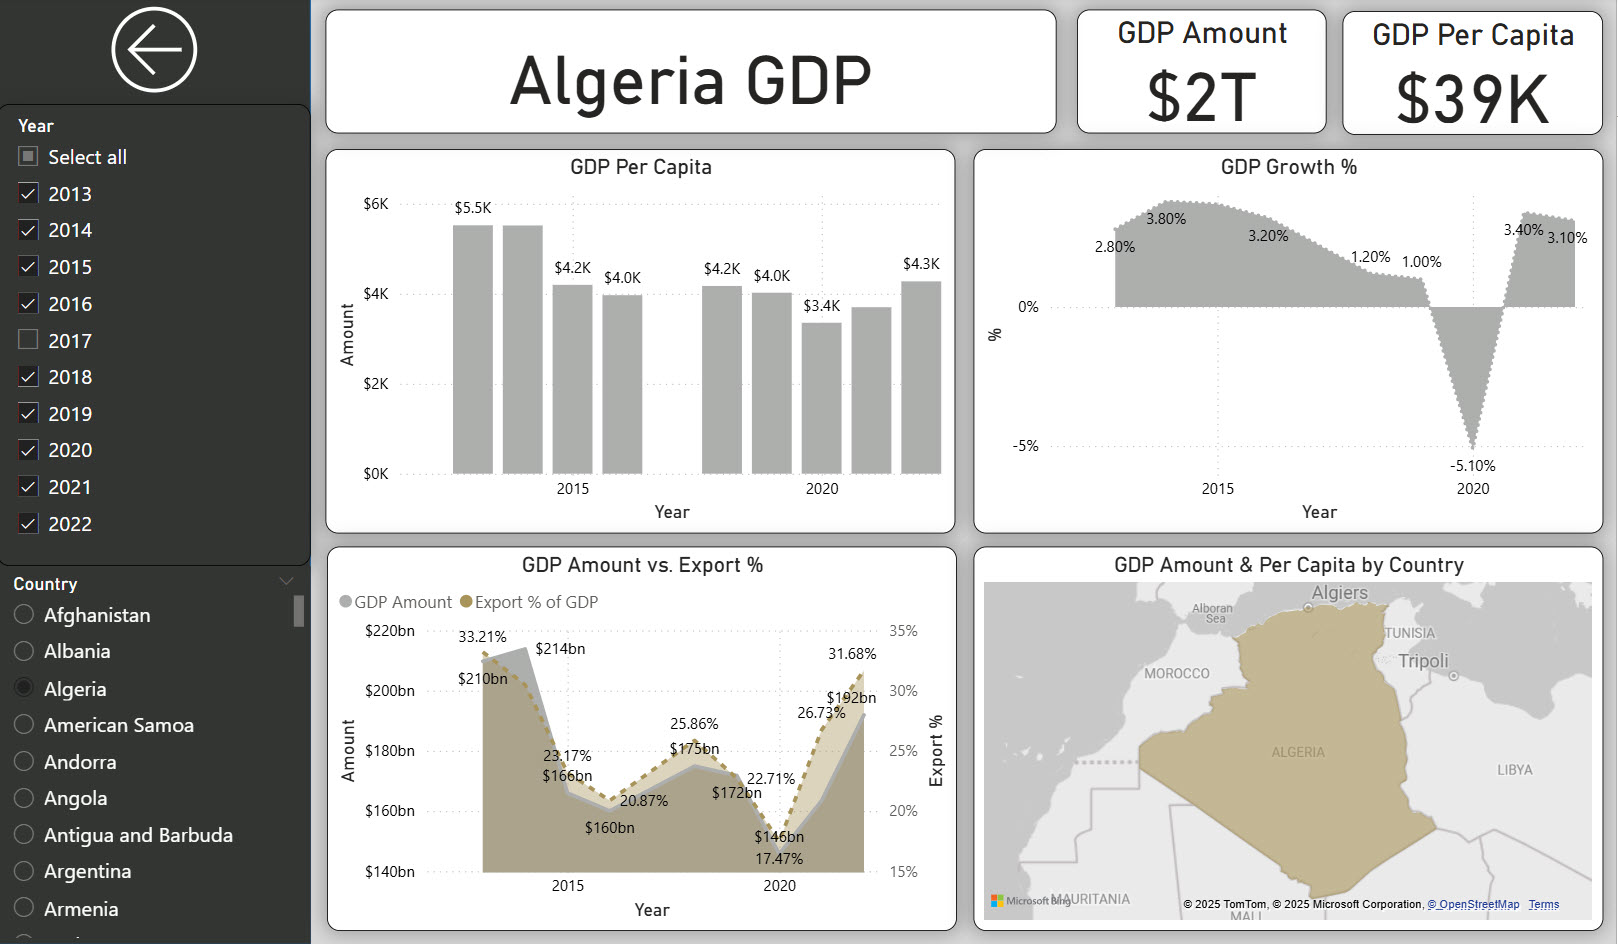
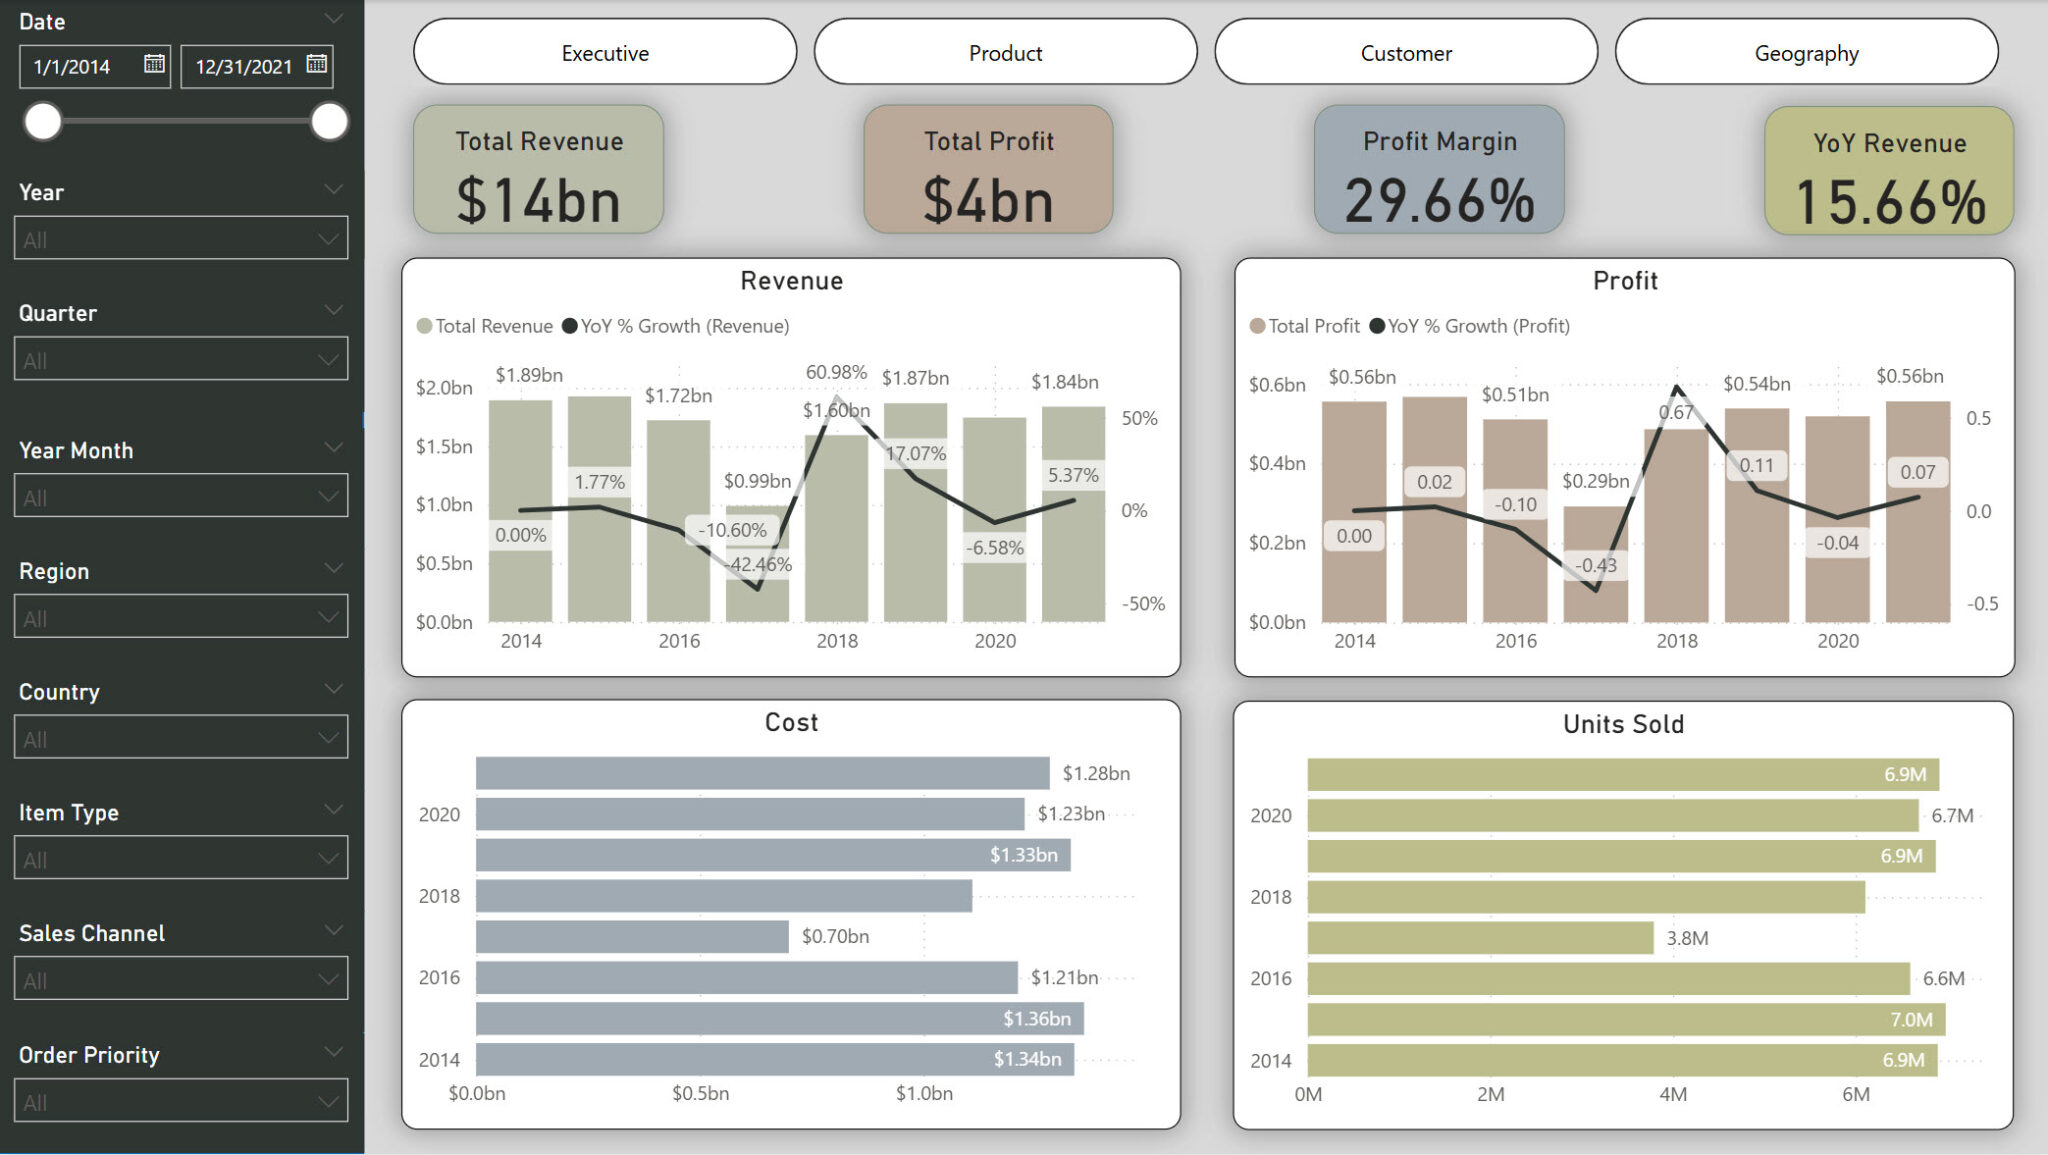
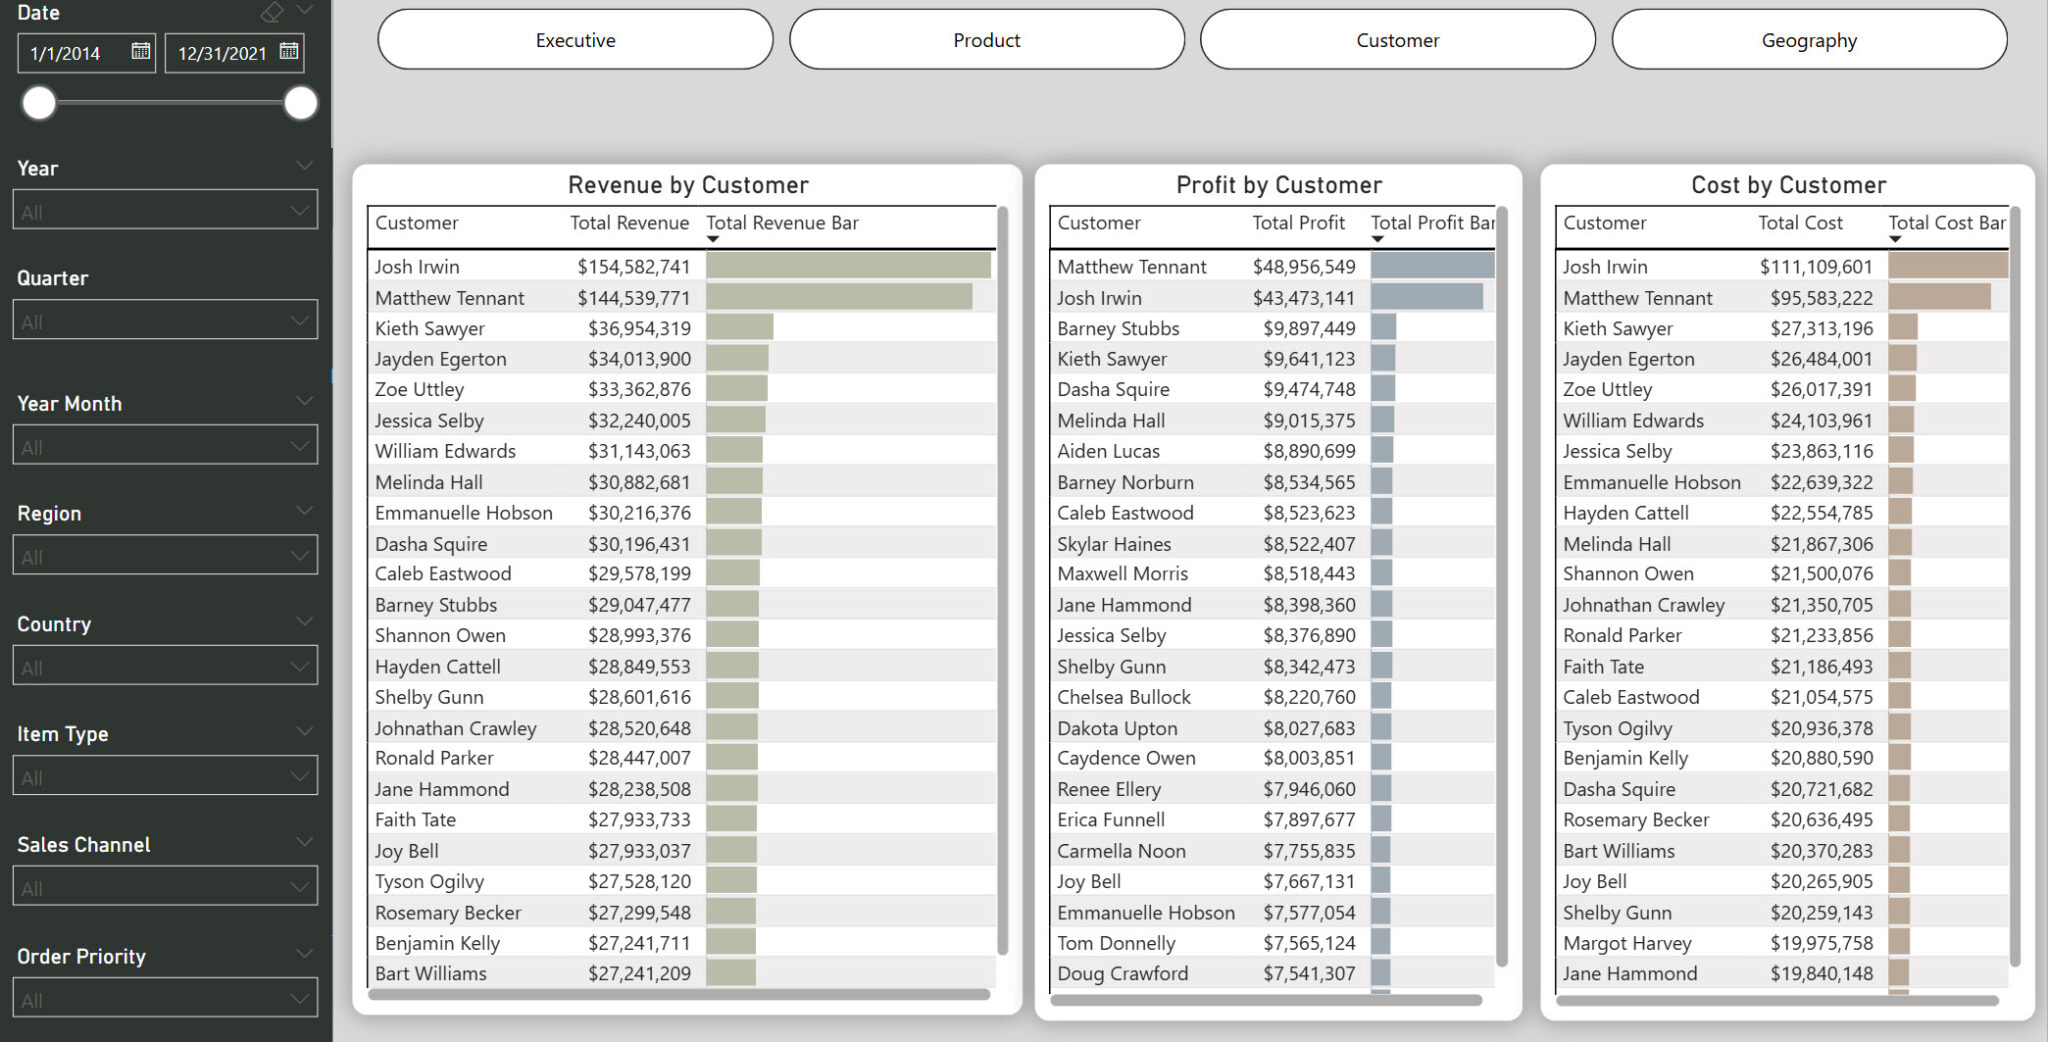
- Build CEO-level dashboards using Power Query, DAX, and Power Pivot.
Power BI Data Preparation
Clean, Organize Data with Power Query
- Clean messy data automatically using Power Query methods.
- Organize raw data into ready-to-use formats without coding.
Power BI Dashboards
Design Dynamic Dashboards for Impact”
- Create interactive dashboards with slicers, filters, and custom visuals.
- Present insights that impress decision-makers every time.
06
Build below Killer Dashboards
Start Your Data Analyst Journey now
Excel + Power BI in 55 Straightforward chapters – Turn Skills into Salary!
04
04
04
04
01 Excel - Fundamentals & Interface
Lay a bulletproof foundation—navigate Excel’s UI like a pro from Day 1.
Excel Structure & Templates
Jumpstart your projects with ready-made designs.
Workbook Management
Open, close, and save files faster (goodbye endless searching).
User Interface & Shortcuts
Speed up your tasks with pro-level shortcuts.
Custom Toolbars & Ribbons
Tailor Excel to your workflow so every feature is at your fingertips.
02 Excel - Data Handling & Formatting
Make your worksheets pop and clarity skyrocket.
Data Types (Text, Number, Date, Time):
Eliminate confusion when mixing different data.
Autofill & Editing
Slash manual entry time by 50% or more.
Standard/Conditional Formatting
Highlight key insights automatically.
Improve Readability
Present data so managers actually understand it (and appreciate you for it).
03 Excel - Organizing with Worksheets, Ranges, and Tables
Handle larger datasets without losing your mind.
Comprehensive Worksheet/Range Functionality
Quickly sort, filter, and reformat massive data.
Effective Table Features
Build dynamic “living” tables—cut your data confusion for good.
04 Excel - Mastering Formulas
Say goodbye to guesswork—command Excel’s formula engine.
Cell References (Absolute, Relative, Mixed):
No more broken formulas or mysterious errors.
Named Ranges & Table Formulas
Keep your spreadsheets organized, even with 1,000+ rows.
Math & Logical Operators
Go beyond sum—learn how to pivot any scenario with ease.
05 Excel - Exploring Functions
Compute, audit, and transform data in seconds.
Basic, Numeric, and Text Functions
Automate everyday tasks—no more manual retyping.
Date & Time Functions
Tame scheduling, deadlines, and project timelines.
Logical, Match & Lookup Functions
Master VLOOKUP, INDEX-MATCH, and more for unstoppable data retrieval.
Conditional Functions & Auditing
Spot-check logic errors before they cost you.
06 Excel - Data Visualization with Charts
Turn raw numbers into eye-popping visuals that wow any audience.
Chart Types & Best Practices
Pick the perfect chart for your data
Building Dashboards & KPIs
Craft management-ready insights at a glance.
Logical, Match & Lookup Functions
Master VLOOKUP, INDEX-MATCH, and more for unstoppable data retrieval.
Design Principles
Avoid ugly or confusing graphs—ensure clarity that drives decisions.
07 Excel - ETL, Validation, and Grouping Techniques
Keep your data squeaky-clean and grouped for efficient analysis.
Data Extraction, Transformation, Loading (ETL)
Merge multiple data sources effortlessly.
Data Validation Methods
Prevent mistakes before they happen.
Efficient Data Grouping
Break down massive tables so you see only what matters.
08 Excel - PivotTables for Analysis & Reporting
Summarize thousands of rows in a click—become the office “pivot wizard.”
PivotTable Intro & Analysis
Turn raw data into actionable insights.
Design & Report Generation
Produce clear, polished reports in minutes (not days).
Advanced PivotTable Tricks
Drill down deeper with custom calculations, timelines, and slicers.
09 Excel - Power Query for Modern Data Management
Stop manual data cleaning—automate it.
Power Query Basics
Connect to multiple sources, unify data, save loads of time.
Data Extraction & Transformation
Eliminate mind-numbing cleanup tasks with a repeatable process.
Data Loading
Seamlessly integrate new data in seconds.
10 Excel - Advanced Data Analysis with Power Pivot & DAX
Tackle big data with ease—outclass your competition
Power Pivot Overview
Handle huge data sets with minimal lag.
Data Model Building
Link multiple tables for advanced analyses.
DAX Formulas
Slice and dice info with powerful measures, from quick sums to complex time intelligence.
11 Excel - Advanced Tools—Goal Seek, Scenario Manager, and Forecasting
Predict outcomes, optimize decisions, and become your team’s strategic hero.
Goal Seek & Scenario Manager
Rapidly test “what-if” scenarios for smarter moves.
Data Tables
Optimize budgets, schedules, or inventory constraints.
Forecast Sheets
Stay ahead of future trends.
12 Excel - Data Protection Techniques
Safeguard sensitive info, earn top-level trust.
Worksheet & Workbook Protection
Control access and edits.
Secure Workbook Structures
Prevent accidental (or malicious) changes.
VBA Code Protection
Hide and secure your custom scripts.
13 Excel - Automation with Macros & VBA
Unleash Excel’s secret superpower—automate everything.
Enabling Developer Tools
Gain access to advanced macro features.
Macro Creation & Management
Cut hours from repetitive tasks.
Intro to VBA &UserForms
Build custom solutions only limited by your imagination.
14 Power BI - Introduction to Power Query
Lay a Solid Foundation for Data Transformation
What is Power Query?
Learn how it simplifies data transformation.
Why use Power Query?
Automate tasks and eliminate repetitive work.
Power Query Versions
Ensure compatibility and access the latest features.
Power Query Editor
Get hands-on with the interface.
15 Power BI - Power Query Starter Kit
Master the Core Tools of Data Prep
Transform vs. Add Column
Navigate and manage queries efficiently.
View Options
Customize your workspace for optimal efficiency.
Data Types & Conversions
Maintain data integrity.
Query Reference vs. Duplicate
Learn when to reuse or copy queries.
Query Dependencies (Graphic View)
Visualize relationships between queries.
16 Power BI - Data Connection
Connect to Multiple Data Sources Effortlessly
Tables & Ranges
Pull structured data from Excel.
Excel Files, CSV & Text Files
Import large datasets seamlessly.
Access Databases, JSON & PDF Files
Work with diverse formats.
Webpages & APIs
Automate live data extraction.
Combining Data from Folders
Merge multiple files dynamically.
17 Power BI - Basic Transformation
Clean and Shape Raw Data Efficiently
Removing Unwanted Columns & Rows
Keep only the data you need.
Rearranging & Selecting Columns
Organize datasets effectively.
Promoting & Demoting Headers
Standardize column headers.
Replacing & Filling Missing Values
Prevent errors and inconsistencies.
Manual vs. Auto Data Type Detection
Control your data formats.
18 Power BI - Organizing Data
Sort, Filter, and Structure for Better Analysis
Sorting Data
Perform single and multi-level sorting.
Filtering Data
Apply simple and advanced conditions.
Query Relationships & Dependencies
Understand and manage data connections.
19 Power BI - Text Transformation
Modify and Extract Text Data with Ease
Splitting & Merging Columns
Divide or combine text fields.
Changing Case
Convert text to lowercase, uppercase, or proper case.
Extracting Specific Text
Pull characters from designated positions.
Trimming & Cleaning Data
Remove extra spaces and unwanted characters.
20 Power BI - Number Transformation
Execute Calculations and Numeric Operations
Basic Calculations
Perform addition, subtraction, multiplication, and division.
Rounding Numbers
Round up, down, or to a specific decimal.
Statistical Functions
Compute sums, averages, medians, and counts.
21 Power BI - Date & Time Transformation
Automate Time-Based Calculations
Extracting Year, Month, & Day
Break down date components.
Age Calculation
Determine durations between dates.
Subtracting & Comparing Dates
Automate time-based reports.
Total Time Metrics
Convert timestamps into meaningful durations.
22 Power BI - Structured Data Type Transformation
Manage Complex Data Types
Index & Duplicate Columns
Add unique identifiers for tracking.
Conditional Columns (If-Then-Else)
Automate logic-based transformations.
Column from Examples
Let Power Query predict and apply transformations.
23 Power BI - Grouping & Summarizing Data
Create High-Level Summaries
Grouping Data by Single & Multiple Criteria
Structure reports efficiently.
Advanced Aggregations
Compute totals, averages, and unique counts.
Summarizing Data Automatically
Generate executive-level summaries.
24 Power BI -Transpose, Unpivot, and Pivot
Reshape Data for Analysis
Pivoting Data
Convert rows into columns.
Unpivoting Data
Transform wide tables into long-format datasets.
Transposing Tables
Instantly switch rows and columns.
25 Power BI - Join & Combine Data (Append & Merge)
Integrate Datasets Seamlessly
Appending Queries
Stack similar datasets together.
Merging Queries
Combine data within Power Query without manual intervention.
26 Power BI - Parameters
Create Dynamic and Flexible Queries
Creating & Applying Parameters
Dynamically switch data sources.
Filtering with Parameters
Automate user-driven selections.
Parameter-Based Conditional Logic
Optimize workflows efficiently.
27 Power BI - M Language Starter Kit
Unlock the Power of Custom Transformations
Understanding M Language
Learn the syntax and structure.
Writing Basic M Expressions
Create custom transformations.
Error Handling & Debugging
Prevent and resolve common issues.
28 Power BI - M Functions
Extend Your Power Query Capabilities
Built-in M Functions
Explore key functions for data transformations.
Custom Function Creation
Automate repetitive tasks.
Nesting & Referencing Functions
Combine functions for advanced operations.
29 Power BI - Load
Control Data Loading for Optimal Performance
Loading Data in Data Model
Choose the best method for your needs
Disable Queries
Optimize performance by managing unnecessary loads.
30 Power BI - Intro to Data Modeling
Build a Foundation for Analysis
What is Data Modeling
Understand essential concepts.
Important Concepts
Lay the groundwork for robust data models.
31 Power BI - Designing the Star Schema
Optimize Your Data Structure
Star Schema vs. Snowflake Schema:
Learn the differences.
Fact and Dimension Tables
Build structured data models.
Relationship
Establish clear data connections.
32 Power BI - Advanced Modeling Techniques
Tackle Complex Data Scenarios
Multiple Fact Table
Manage data from various sources.
Aggregate Tables
Summarize large datasets effectively.
33 Power BI - Performance Optimization
Maximize Data Model Efficiency
Reduce Data Model Size
Streamline your datasets.
Calculated Column vs. Measures
Optimize your calculations.
VertiPaq Engine
Leverage advanced compression for faster performance.
34 Power BI - Intro to DAX
Dive into Powerful Data Analysis Expressions
What is DAX?
Get introduced to this dynamic formula language.
Different Data Types
Explore various DAX data types.
Calculated Column vs. Measures
Learn when and how to use each.
35 Power BI - Fundamentals of Context
Master Row and Filter Context in DAX
Row Context vs. Filter Context
Understand the differences.
CALCULATE Function
Transition from row to filter context for precise calculations.
36 Power BI - Essential DAX Functions
Build Your Analytical Toolkit
Aggregate Functions
Summarize data efficiently.
Logical Functions
Integrate decision-making logic.
Text Functions
Manipulate textual data within calculations.
Date Functions
Dynamically work with dates.
Variables
Simplify complex formulas.
Comment and Organize
Keep your DAX code clear and maintainable.
37 Power BI - Time Intelligence
Analyze Trends Over Time
12 Months
Track monthly performance.
YOY Growth
Compare year-over-year metrics to gauge progress.
38 Power BI - Advanced DAX Functions
Elevate Your Analysis
CALCULATE Function
Perform advanced calculations.
FILTER Function
Refine data queries.
Iterator Functions
Process data iteratively.
Table Functions
Manipulate entire tables for comprehensive analysis.
39 Power BI - DAX Best Practices and Debug
Write Clean, Efficient Code
Organize Measures and Calculated Columns
Keep your model structured.
Comment Code
Document your logic for clarity.
Measure Folder
Systematically structure your measures.
Naming Convention
Ensure consistency across your model.
DAX Query View
Troubleshoot and optimize your formulas.
40 Power BI - Basic Charts
Create Fundamental Visualizations
Bar, Column & Line Charts
Visualize comparisons and trends.
Pie & Doughnut Charts
Represent data proportions effectively.
41 Power BI - Table, Matrix, and Conditional Formatting
Present Data Clearly
Tables and Matrix
Build detailed and cross-tab reports.
Conditional Formatting
Highlight key insights automatically.
42 Power BI - Slicers, Filters, and Report Interactivity
Enhance User Engagement
Interactive Reports
Create dynamic dashboards with slicers and filters.
Report Interactivity
Enable viewers to explore data intuitively.
43 Power BI - Hierarchies, Drill Down, Drill Up, and Drill Through
Navigate Data Layers
Hierarchies
Organize data into structured levels.
Drill Down/Up
Explore and summarize information seamlessly.
Drill Through
Access detailed underlying data effortlessly.
44 Power BI - Treemap Chart, Combo, and Scatter Plot
Advanced Visualizations
Treemap Chart
Visualize hierarchical data effectively.
Combo Chart
Combine multiple chart types for deeper insights.
Scatter Plot Chart
Identify correlations and outliers in your data.
45 Power BI - Card, KPI, Gauge, and Funnel
Showcase Critical Metrics
Card & KPI
Highlight key performance indicators.
Gauge Chart
Visualize progress toward targets.
Funnel Chart
Illustrate process flow and conversion rates.
46 Power BI - Custom and AI Visual
Leverage Cutting-Edge Analytics
Custom Visuals
Integrate third-party visuals for enhanced reporting.
AI Visuals
Utilize artificial intelligence to gain deeper insights.
47 Power BI - Bookmarks, Page Navigation, and Other Tips
Enhance Report Usability
Bookmarks
Save and share specific report states.
Page Navigation
Create intuitive, multi-page report flows.
Other Tips
Discover shortcuts and best practices for an improved user experience.
48 Power BI - Dashboard Design Best Practices
Create Compelling Dashboards
Effective Design Principles
Learn key strategies for impactful dashboards.
Layout & Aesthetics
Build visually appealing and user-friendly interfaces.
User Experience
Optimize dashboards for maximum engagement.
49 Power BI - Building Dashboard
Apply Your Skills in a Real-World Project
End-to-End Dashboard Creation
Integrate data, visuals, and interactivity.
Practical Application
Develop a portfolio-ready dashboard that drives business insights.
50 Power BI - Intro to Power BI Service
Master the Cloud-Based Platform
Power BI Desktop vs. Service
Understand key differences and advantages.
Licensing Options
Choose the best plan for your needs.
Navigating the Service
Get comfortable with the online interface.
51 Power BI - Publishing, Sharing, and Consuming Content
Distribute Your Insights
Consume Reports
Learn how to view and interact with published content.
Different Report Types
Understand various formats and their uses.
Sharing & Permissions
Collaborate securely by managing access and publishing Power BI apps.
52 Power BI - Report Navigation
Create Engaging, Interactive Dashboards
Overview of Report Features
Familiarize yourself with essential navigation tools.
Filters, Slicers & Bookmarks
Enhance interactivity and user control.
53 Power BI - Report Development
Craft Professional Reports with Ease
Power BI Service & Desktop
Build reports using robust online and offline tools.
Best Practices
Implement industry standards for clear, actionable reports.
54 Power BI - Power BI Service Settings Overview
Optimize Your Online Environment
Customization
Tailor settings to fit your workflow.
Performance Maintenance
Keep your service updated and running smoothly.
55 Power BI - Integration with Other Tools
Expand Your Analytics Ecosystem
Seamless Integration
Connect Power BI with Excel, Teams, PDF, and PowerPoint.
Unified Business Intelligence
Leverage multiple platforms for a comprehensive strategy.
Get These AMAZING Bonuses...
When you join the 'Analyst Accelerator' Today
Bonus #1

Excel eBook
Never guess a formula or best practice again—keep this “forever reference” by your side.
Mirrors the Entire Course
Reinforce each lesson with quick-to-find tips and examples.
Practical Tips & Insights
Stay ahead of the curve—no more random Googling at crunch time.
Lifetime Resource
Print it out or keep it on your desktop—eliminate guesswork forever.
Bonus #2

Excel Real-World Project Video Course
Systematic Approach
Turn messy CSV, JSON, and Excel files into streamlined reports.
Advanced Tools
Power Query, Power Pivot, VBA—learn how pros handle real data challenges.
Project Steps
Data Collection
Collect data from several diverse sources, including CSV, JSON, and Excel files.
Data Transformation
Use Power Query for data extraction, transformation, and loading.
Data Reporting
Load data into Excel for reporting and to Data Model (Power Pivot) for calculations.
Data Analysis
Create relationships, calculate columns, build measures using DAX, and generate PivotTables for reports.
Data Automation
Develop macros to refresh data and export it into new workbooks.
Data Visualization
Design charts, graphs, KPIs, and dashboards to consolidate information.
Excel Project Framework & Best Practices
Automate and make your analysis flexible and reproducible, enabling you to share insights with your colleagues efficiently.
Bonus #3
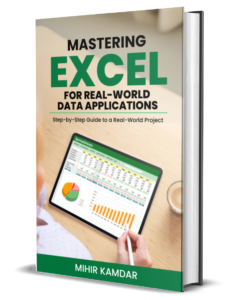
Excel Real-World
Project eBook
Frameworks, Checklists, Advanced Examples
Confidently replicate high-level workflows.
Perfect Companion
Pair with the Real-World Project Video Course to instantly implement every concept.
Professional Edge
Apply Excel in any setting, from small businesses to corporate giants.
Bonus #4
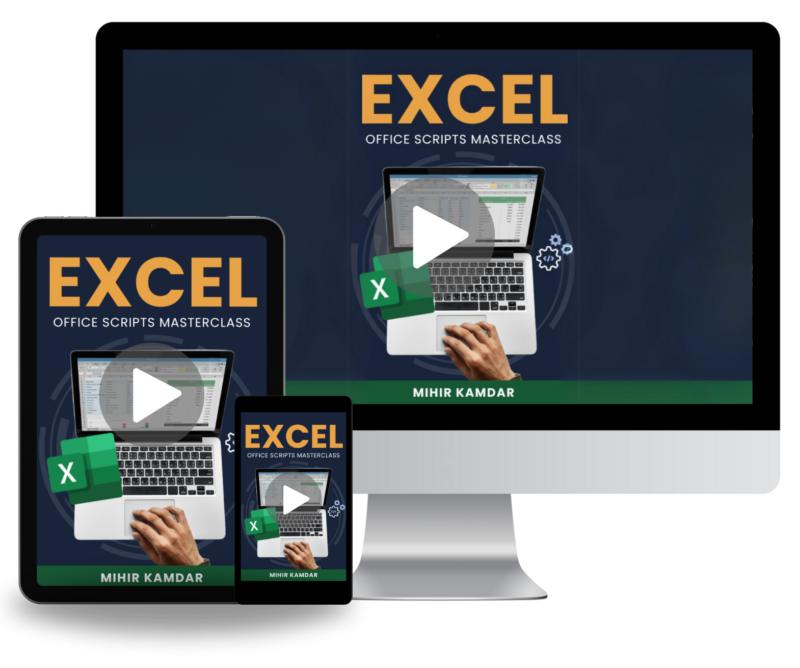

Excel Office Scripts Masterclass
Take your automation game to a modern, cloud-ready level—record actions, collaborate, and power-up your Excel workflows without complex coding.
Topics Covered
Introduction to Office Scripts
Unlock next-gen workflow potential right inside Excel.
Overview & Action Recording
Record tasks step by step—turn manual chores into one-click processes.
Foundations & Working with Data
Scale your tasks across multiple sheets and workbooks effortlessly.
Data Analysis & Workflow Automation
Move beyond local macros—manage, share, and automate in the cloud.
Bonus #5
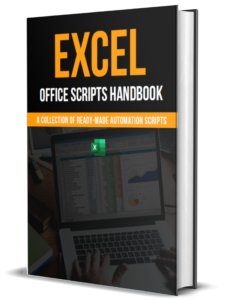
Office Scripts Handbook
No more guesswork—turn your Office Scripts Masterclass into a permanent reference library. Every function, procedure, and best practice is laid out for quick lookup and real-time solutions.
Topics Covered
Data Manipulation & Worksheet Management
Seamlessly rearrange, clean, and structure your data.
Formatting, Formulas & Calculations
Custom script your entire workbook style and advanced calculations.
Charts & Visualizations
Automate visual reporting so stakeholders see insights, not raw numbers.
Protection & Security
Lock down vital spreadsheets with confidence.
Data Validation & Conditional Formatting
Make error-free data entry the rule, not the exception.
Collaboration & Sharing
Streamline multi-user tasks and file sharing.
Importing & Exporting Data
Manage large data flows without drudgery.
Bonus #6
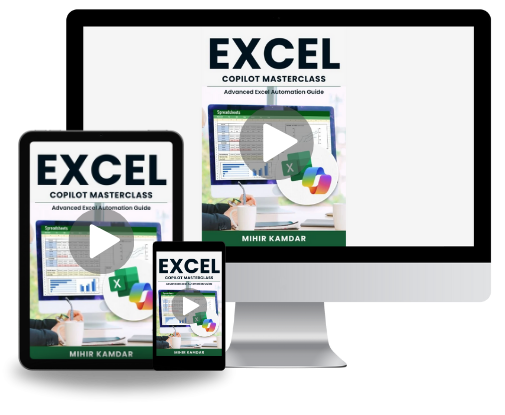

Excel Copilot Masterclass
Leverage AI-like Copilot features in Excel—automatically generate formulas, speed up data entry, and drastically reduce busywork across your entire workflow.
Topics Covered
Basic Data Entry & Manipulation
Offload repetitive tasks to Copilot so you can focus on strategy.
Formula & Function Generation
Type your intent—let Copilot propose advanced formulas on the fly.
Data Analysis & Visualization
Power through tasks like pivot charts, trend analysis, or summary dashboards effortlessly.
Automation & Code Generation
Transform your typed commands into macros or scripts—accelerating your coding from hours to minutes.
Bonus #7


Power BI Project
Step by Step
Step-by-step project guidance that mirrors real business scenarios.
Sucessful Dashboard
A portfolio-ready dashboard that showcases your newfound expertise.
Here's a Recap Of Course +
Everything You'll get fREE
Excel + Power BI Course Goodies
- 30+ hours of content packed in 55 chapters, from Excel fundamentals to advanced Power BI analytics.
- Streamlined approach—no fluff, just rapid skill-building.
- Exercise Workbooks: Hands-on practice that helps you truly absorb each lesson.
- Interactive Quiz: Test your knowledge and reinforce learning to master key concepts.
- Intuitive Online Platform: Focus on learning, not navigating complicated software.
- Practical Projects: Tackle real-world scenarios that translate directly into workplace wins.
- Course Certificate: Showcase your microsoft excel and power bi course proficiency—ideal for resumes or LinkedIn
7 FREE Bonuses
-
Excel eBook $50
A permanent reference packed with Excel info.
-
Excel Real-World Project Video Course $250
An end-to-end Excel workflow project.
-
Real-World Project eBook $50
A step-by-step blueprint for applying Excel.
-
Excel Office Scripts Masterclass $100
Modern automation for the new Excel.
-
Office Scripts Handbook $50
A deep-dive manual for automation task.
-
Excel Copilot Masterclass $150
AI to 10x your productivity.
-
Power BI Real-World Project Video Course $500
An end-to-end Power BI workflow project.
Total Value: $2,650
Hello! I’m Mihir Kamdar
Hello! I’m Mihir Kamdar, an Excel & Power BI nerd with over a decade of extensive experience across multiple sectors. My goal is to simplify data analytics, making it user-friendly and accessible for everyone.
I crafted this course to share practical insights and real-world strategies. My experiences are distilled into clear, actionable guidance that empowers students to master Excel Power BI Course.
My Teaching Philosophy
Data should work FOR you, not the other way around. My job? Turn you from Analytics zero to hero—fast.
Have Any Questions?
Is this course suitable for complete beginners?
Absolutely! Analytics Accelerator is designed to take you from novice to expert, regardless of your starting point.
How long will it take to complete the course?
The course takes 30 hours.
Can I access the course on multiple devices?
Yes, you can access the course from any device—desktop, tablet, or smartphone—so you can learn anytime, anywhere.
Is there a money-back guarantee?
No, we do not offer a money-back guarantee.
Are there any prerequisites for taking this course?
No prerequisites are needed.
Does the course include assignments or quizzes?
Yes, there are assignments and quizzes.
Will there be updates to the course content?
We continually refine and improve our training based on student feedback, ensuring you always receive the most up-to-date and effective learning experience possible.
How long can I access the course?
You’ll have full access to the course for 12 months, allowing you to learn at your own pace and revisit lessons anytime within that period.
Who can I contact for support if I have questions while going through the course?
Once you purchase the course, you can ask questions in the course discussion section, and we will be happy to assist you.
How can I provide feedback or review the course?
We value your feedback! Submit your review or suggestions by emailing [email protected].
Every hour you wait costs 10+ hours of wasted effort. 92% of students build dashboard in < 1 hour—don’t miss this opportunity.