How to Build a Dashboard in Excel Using Analyze Data

How to Build an Excel Dashboard Using Analyze Data Learn how to build an Excel dashboard using Analyze Data with step-by-step instructions, prompts, and a real-world dataset. by Mihir Kamdar / Last Updated: Home What You’ll Learn After reading this guide, you’ll be equipped with the knowledge to: How to prepare your data in Excel […]
Excel Dashboard: Complete Guide to Charts & Dashboards in Excel | Modern Visualization (2025)
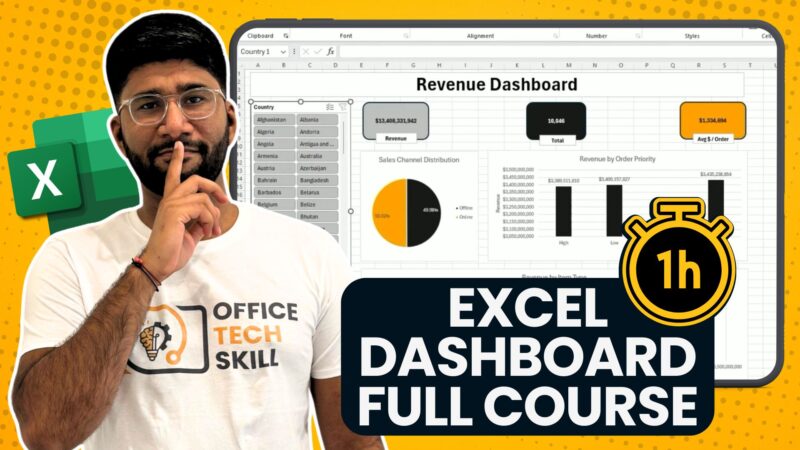
Excel Dashboard: Complete Guide to Charts & Dashboards in Excel (2025) Get the ultimate guide to Microsoft Excel charts and dashboards. Learn how to create interactive dashboards, 16 chart types, templates, and integrate Power BI for data visualization. by Mihir Kamdar / Last Updated: Home What You’ll Learn In this guide you’ll learn: 16 Excel […]
How to Create a Stock Portfolio Tracker in Excel
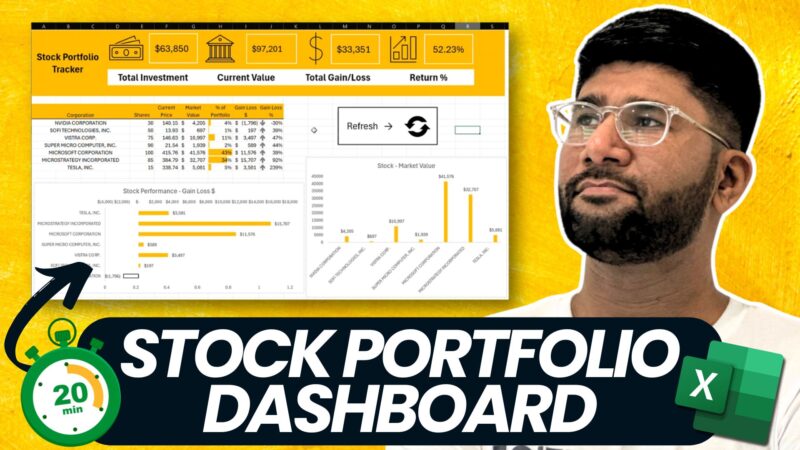
How to Create an Excel Stock Portfolio Tracker: Visual Guide Learn how to build a professional stock portfolio tracker in Excel with real-time updates, automated calculations, and visual dashboards. Includes step-by-step instructions, formulas, and charts for tracking investments effectively. by Mihir Kamdar / Last Updated: Home What You’ll Learn In our step-by-step guide on how […]
How to Create Powerful Excel KPI Dashboards
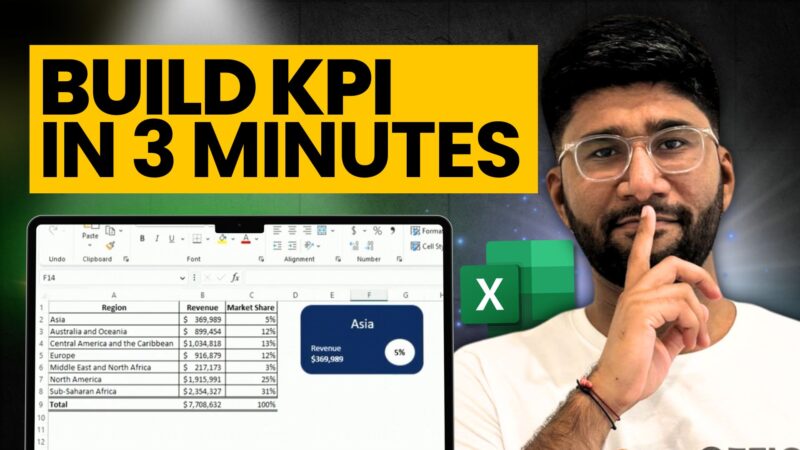
How to Create Powerful Excel KPI Dashboards Learn how to build professional KPIs using shapes and SmartArt with step-by-step instructions. Perfect for business analysts and Excel users. by Mihir Kamdar / Last Updated: Home What You’ll Learn After reading this guide, you’ll be equipped with the knowledge to: Creating professional KPI visuals Mastering Excel shapes […]
How To Do Conditional Formatting in Excel
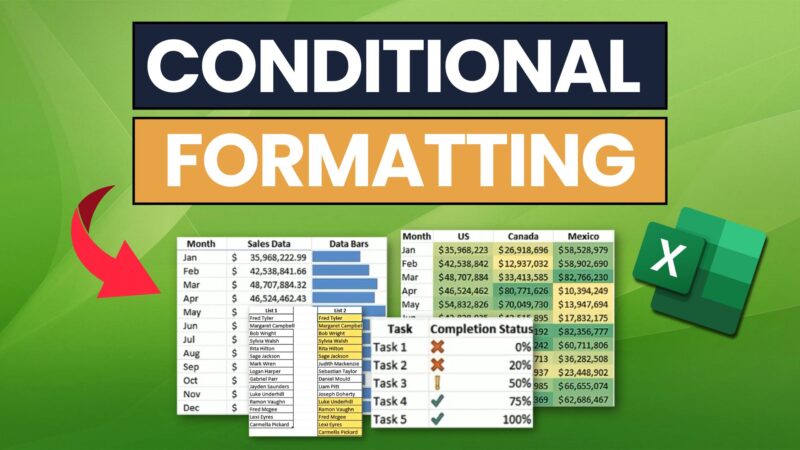
Excel Conditional Formatting: A Complete Course to Visualise Data Level up your Excel skills and unlock the power of data visualisation with conditional formatting. This course will take you from basic formatting to advanced data analysis techniques to change the way you work with spreadsheets. by Mihir Kamdar / Last Updated: Home What You’ll Learn […]
How to Create Excel Progress Bar: 5 Powerful Methods
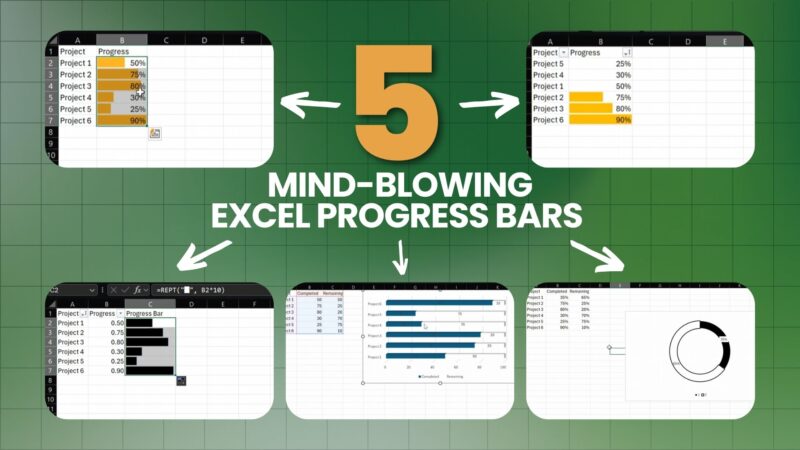
How to Create Excel Progress Bar chart: 5 Powerful Methods Discover how to create a excel progress chart and eye-catching progress bars in Excel using five different methods. From simple conditional formatting to advanced chart techniques, this guide covers everything you need to enhance your spreadsheets with visual data representation. by Mihir Kamdar / Last […]
Master Interactive Excel Dashboards: Your Ultimate Step-by-Step Guide

Master Interactive Excel Dashboards: Your Ultimate Step-by-Step Guide Unlock the secrets to mastering interactive Excel dashboards with our ultimate step-by-step guide. Discover essential tips and tricks to transform your data visualization skills and enhance your reporting. by Mihir Kamdar / Last Updated: Home What You’ll Learn In This Guide This comprehensive guide on building a […]
Essential Elements for Killer Excel Dashboards

Essential Elements for a Killer Excel Dashboards Elevate your Excel dashboards with essential elements and expert tips. Learn how to create compelling visuals and data insights on our blog. by Mihir Kamdar / Last Updated: Home What You’ll Learn In This Guide This comprehensive guide on Excel Charts. By the end of this article, you’ll […]
Excel Charts Mastery: The Ultimate Guide to Unlocking Data Insights

Excel Charts Mastery: The Ultimate Guide to Unlocking Data Insights Master Excel charts with pro tips and techniques for impactful data visualization, driving your career forward! by Mihir Kamdar / Last Updated: Home What You’ll Learn In This Guidez This comprehensive guide on Excel Charts. By the end of this article, you’ll be able to: […]
Mastering Excel Charts: A Comprehensive Guide to Sparkline Charts for Professionals

A Comprehensive Guide to Excel Sparkline Chart for Professionals Excel Charts: Explore our guide on mastering sparkline charts. Learn to create, customize, and use sparkline charts professionally for clear data insights. by Mihir Kamdar / Last Updated: Home What You’ll Learn In This Guide This comprehensive guide on mastering Excel sparkline charts. By the end […]


