Learn how to build a professional stock portfolio tracker in Excel with real-time updates, automated calculations, and visual dashboards. Includes step-by-step instructions, formulas, and charts for tracking investments effectively.
by Mihir Kamdar / Last Updated:
In our step-by-step guide on how to create a live Excel stock portfolio tracker, you’ll learn to:
Download our step-by-step tutorial file now by clicking on the icon below and follow along to enhance your Excel skills practically and efficiently!
To earn like a professional investor, you need access to the same tools. However, while pro investors — and the billion-dollar brokerages backing them — have thousands to spend on proprietary stock portfolio trackers, retail investors don’t. Retail investors need value, the type of value offered by a stock tracker with Excel functions.
This easy-to-follow visual guide will help you create a stock tracker spreadsheet in Excel to rival the best stock tracker apps, websites, or software.
While creating a stock portfolio tracker Excel spreadsheet can be complex, we’ve simplified it. We’ll go over each step with clear instructions and images; all you have to do is follow along.
Essentially, this Excel stock portfolio is better than any paid solution and will have the same result.
Creating a live Excel stock portfolio tracker begins with creating a workbook. Your live stock tracker resides in this workbook and will hold all the data you need to get accurate information about your stock and portfolio performance.
Step 1: Open Excel and Set Up Your Workbook
To create your Excel workbook, you’ll need Microsoft Excel 2016 or later addition; these steps will also work on Microsoft 365. Keep in mind, these steps are designed to create a stock portfolio tracker in Excel and not a Google Sheets stock portfolio tracker.
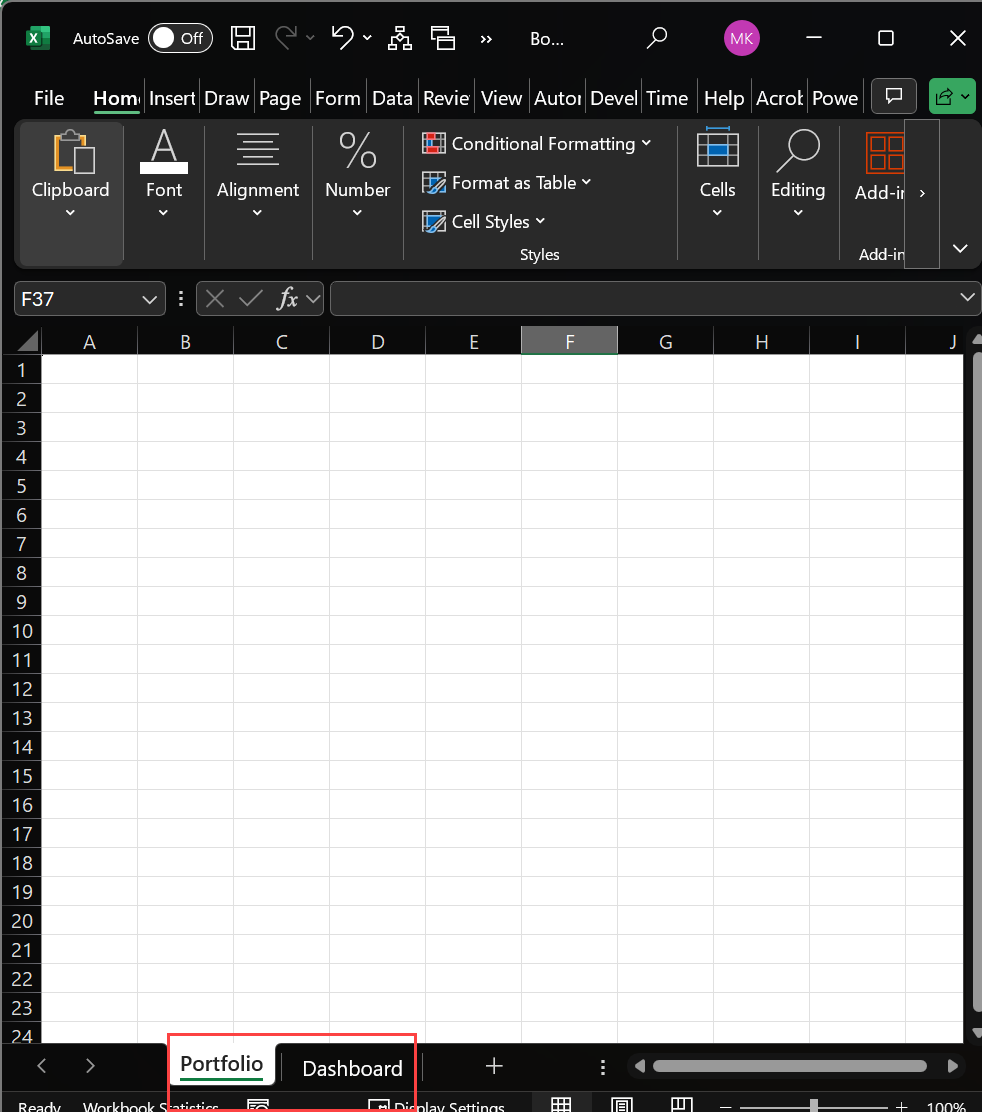
Pro Tip: Creating a three-sheet structure will help you organize your data efficiently. In the above example, we use the following tab titles:
Step 2: Save Your Workbook
The purpose of this guide is to create an easy-to-follow process that means you don’t have to overthink the process. So, now it’s time to save the workbook.
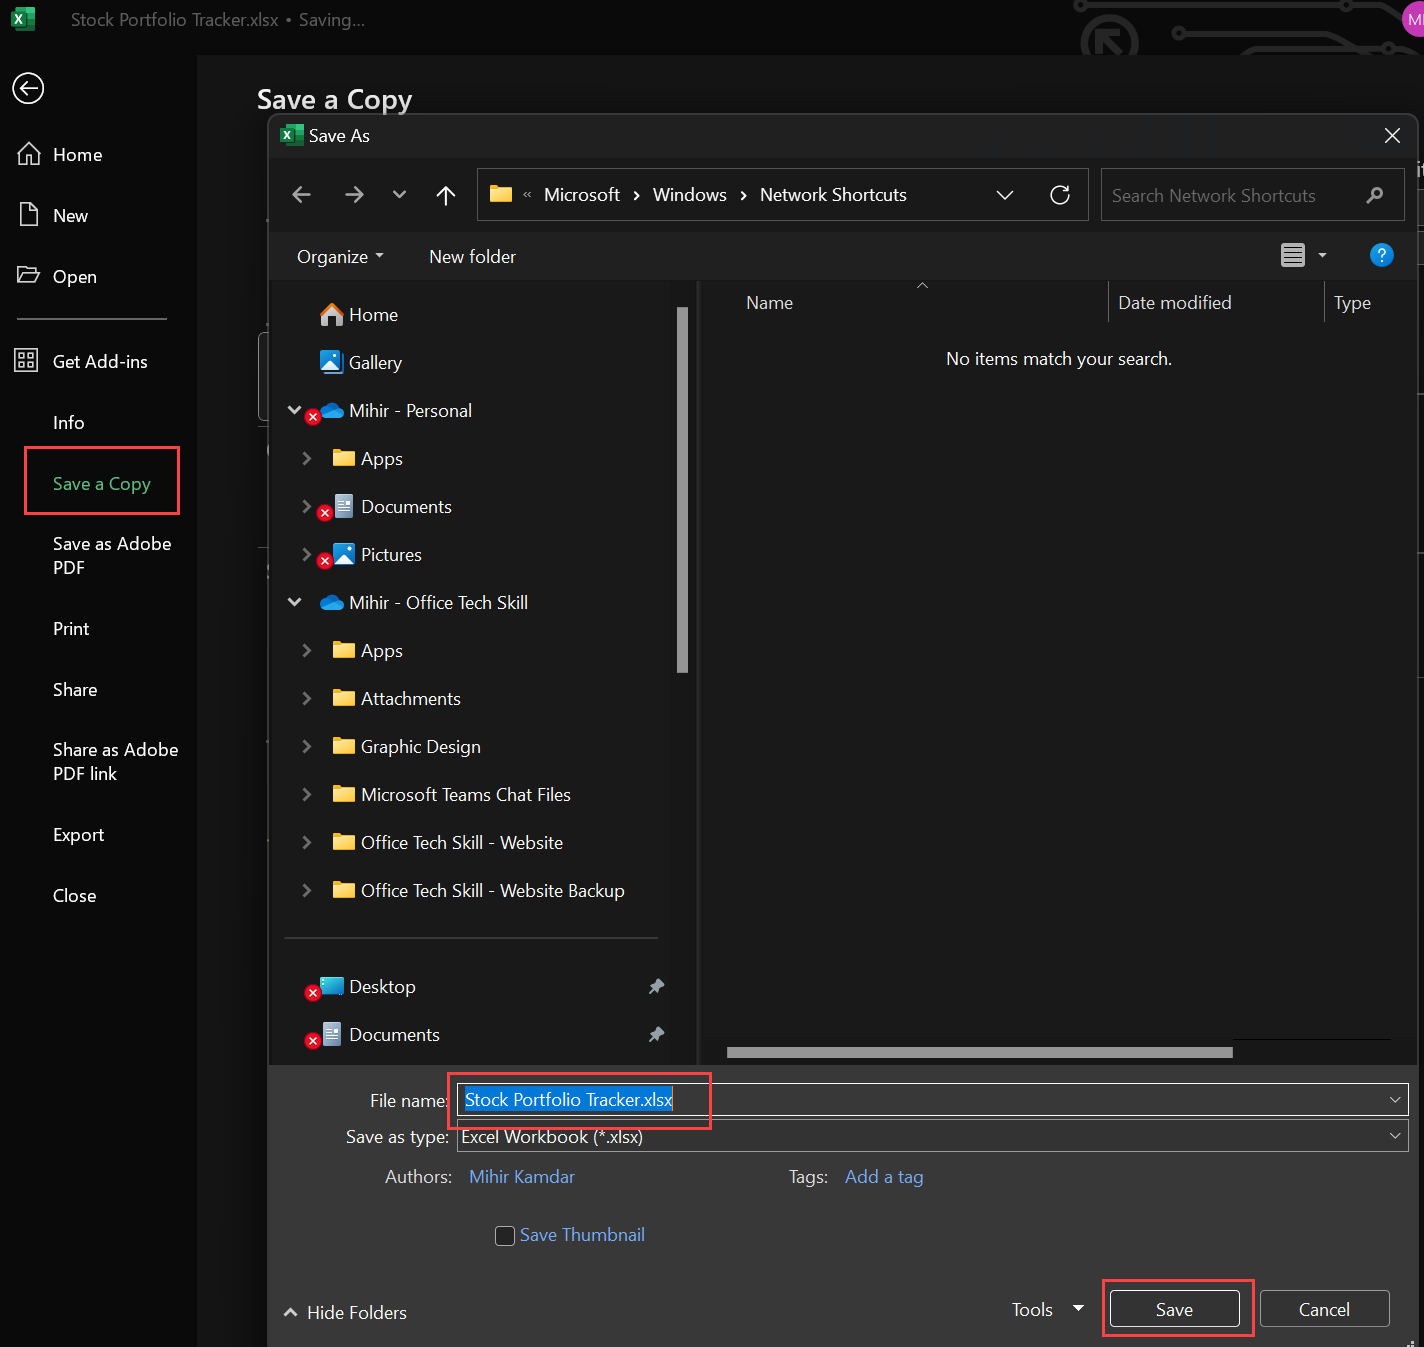
To ensure you’re creating a live stock tracker that functions in Excel, turn your attention to the Portfolio Input sheet.
While this can become complicated, we’ve created a five-step process to simplify it. So let’s build it together.
Step 1: Create 9 Column Headers
Column headers will help you understand what’s happening in your portfolio at a glance.
Step 2: Format Your Headers
To format your headers on the spreadsheet, follow the example below:
Now it’s time to populate your Excel stock portfolio tracker with a diversified example portfolio. You can change the stocks in our example or expand them depending on your needs. Just remember the single function of this stock tracker spreadsheet is to help you track the stocks in your portfolio.
In column A, beneath the ‘Stock Symbol’ headline, enter your stock symbols. In this simple example, we’ve input the following stock symbols:
Step 4: Enable Stock Data Type
In this step, your stock tracker spreadsheet will begin to function as a live stock tracker app with real-time data:
Now, it’s time to enter your purchase information, including how many shares you own, for how much, and when you purchased them. Remember, below are only common examples; enter the figures and dates that apply to your stocks.
In column C (Shares Owned), enter the amounts you have for each stock. Remember, the stocks should correlate with the information in Column B. For this visual example, we’ve entered the following information:
In column D (Purchase Price), enter the price you purchased each share.
In the visual examples, we’ve entered the following values:
In column E (Purchase Date), enter your purchase dates. After entering your dates:
In our example, we’ve entered 1/5/2023 for NVDA.
Drag this formula to the final row of your stocks. In our example that is F8.
After creating the above formula, it’s time to create the formulas that power your Excel stock market tracker.
Step 1: Calculate Market Value
Assigning a dollar value to your gains and losses is easy. Use the formula we’ve outlined below to enhance the function of your real-time stock tracking.
Remember the dashboard tab you created earlier? In this phase, you’ll use the dashboard tab to transform your portfolio tracker Excel spreadsheet into a professional stock monitoring tool. The dashboard will allow you to perform multiple comparisons and examine complex scenarios. The dashboard is also the hub for conducting additional calculations and seeing how your portfolio is performing at the current date.
Step 1: Insert Icons
To improve the function of your Excel stock portfolio tracker and get pertinent information from your dashboard, insert icons. You can choose any icons you’d like to help you evaluate the data. However, these are the ones we’d recommend and have used in our examples.
Type ‘Bank’ in the search bar and add the icon in the example below.
The portfolio summary allows you to evaluate more complex scenarios at a glance. To create it, you’ll need to:
1. Navigate to the ‘Dashboard’ sheet and insert four rectangles (similar to the ones we’ve added in the visual examples below). You can find these shapes in the ‘Shape Format’ tab on the right
2. Fill the shape with the yellow background and remove the black border.

3. Insert four text boxes. The text within the box should be 20+ and bold. Insert the following in each text box:

Step 3: Add Summary Calculations
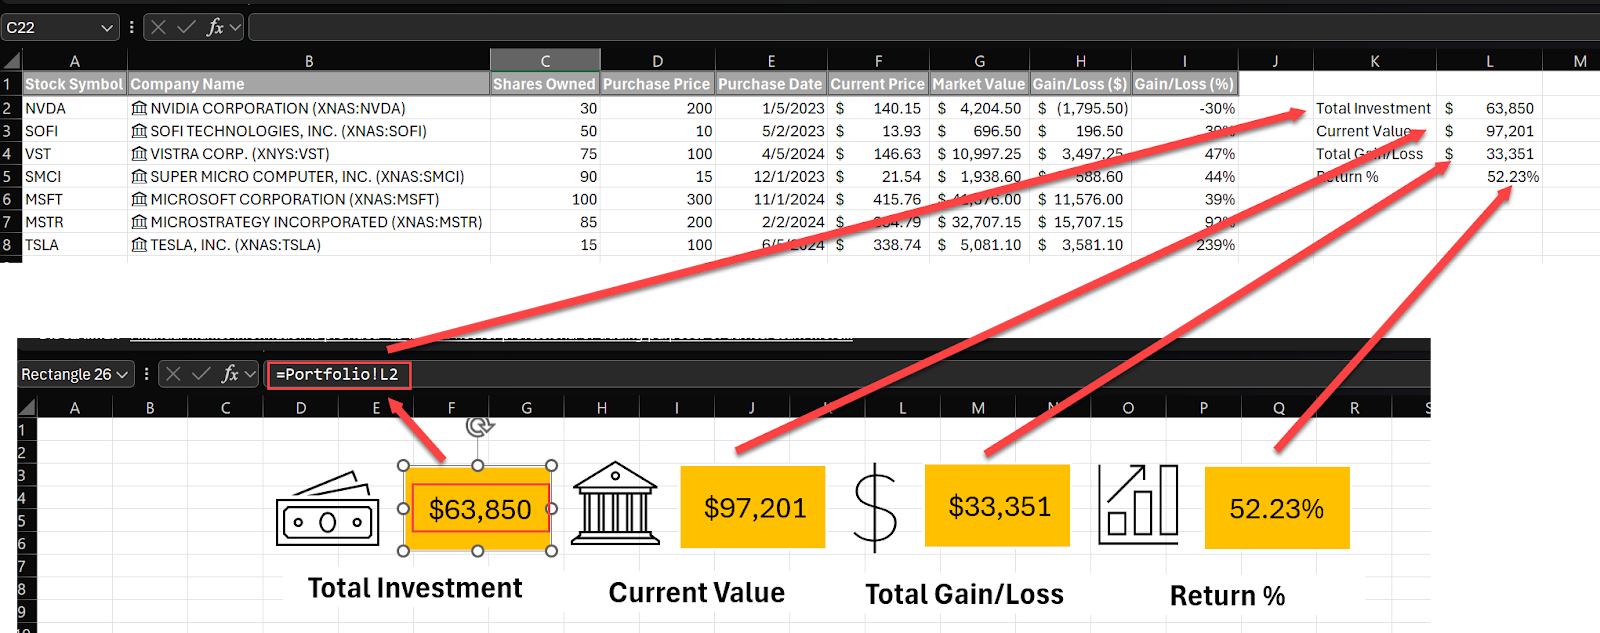
1. For Total Investment add the text in K2 and this one formula in (L2): =SUMPRODUCT(C2:C8,D2:D8)

2. For Current Value add the text values in K3 and formula in (L3): =SUMPRODUCT(C2:C8,F2:F8)

3. For Total Gain/Loss add the text values in K4 and formula in (L4): =L3-L2
4. For Return % add the text in K5 and formula in (L5): =L4/L2

5. Format All Summary Values:



Step 4: Create a Holdings Overview
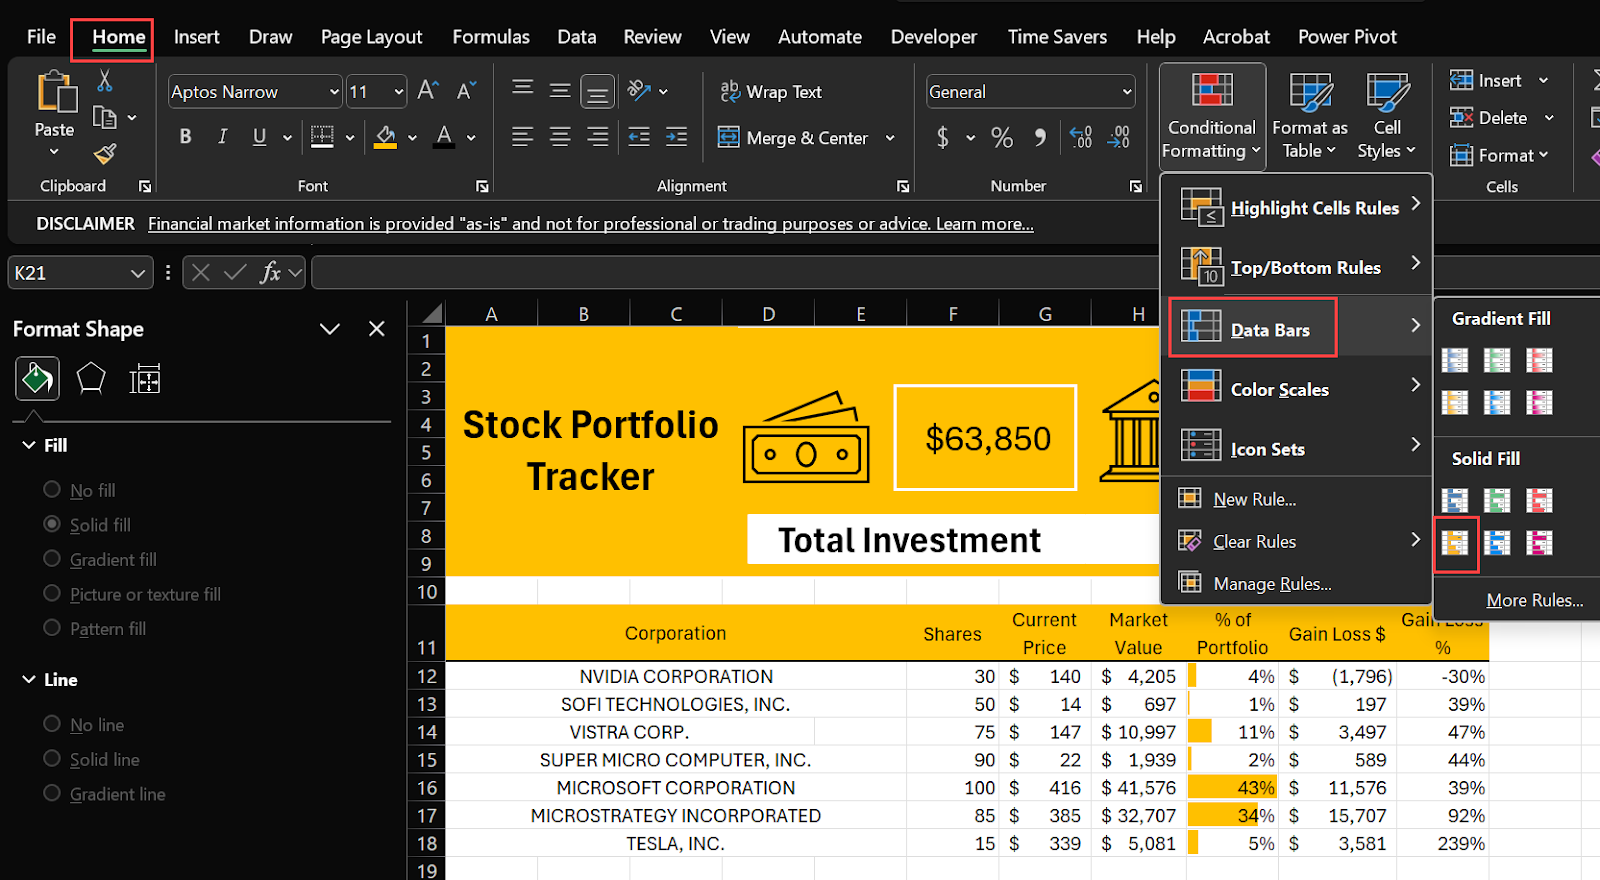
You’re finally done inserting formulas. The rest of this guide to create an Excel stock portfolio tracker is straightforward. In the first part, you’ll create the Holdings Summary Table before conducting conditional formatting in part two.
1. Create a Holdings Summary Table (B11:F11):
2. Format the Holdings Table on the Excel Stock Tracker
To improve the visual appeal of your Holdings Table, we suggest you do the following according to our example:

Beyond icons on your dashboard that help you evaluate your stock portfolio at a glance, we suggest you improve your portfolio data visualization on your stock tracker through charts rivaling any professional stock tracker app.
Step 1: Create a Portfolio Allocation Chart
An asset allocation chart is ideal for tracking your stock diversification and value, giving you an overview of how you’ve distributed your funds.
1. On your Dashboard sheet:
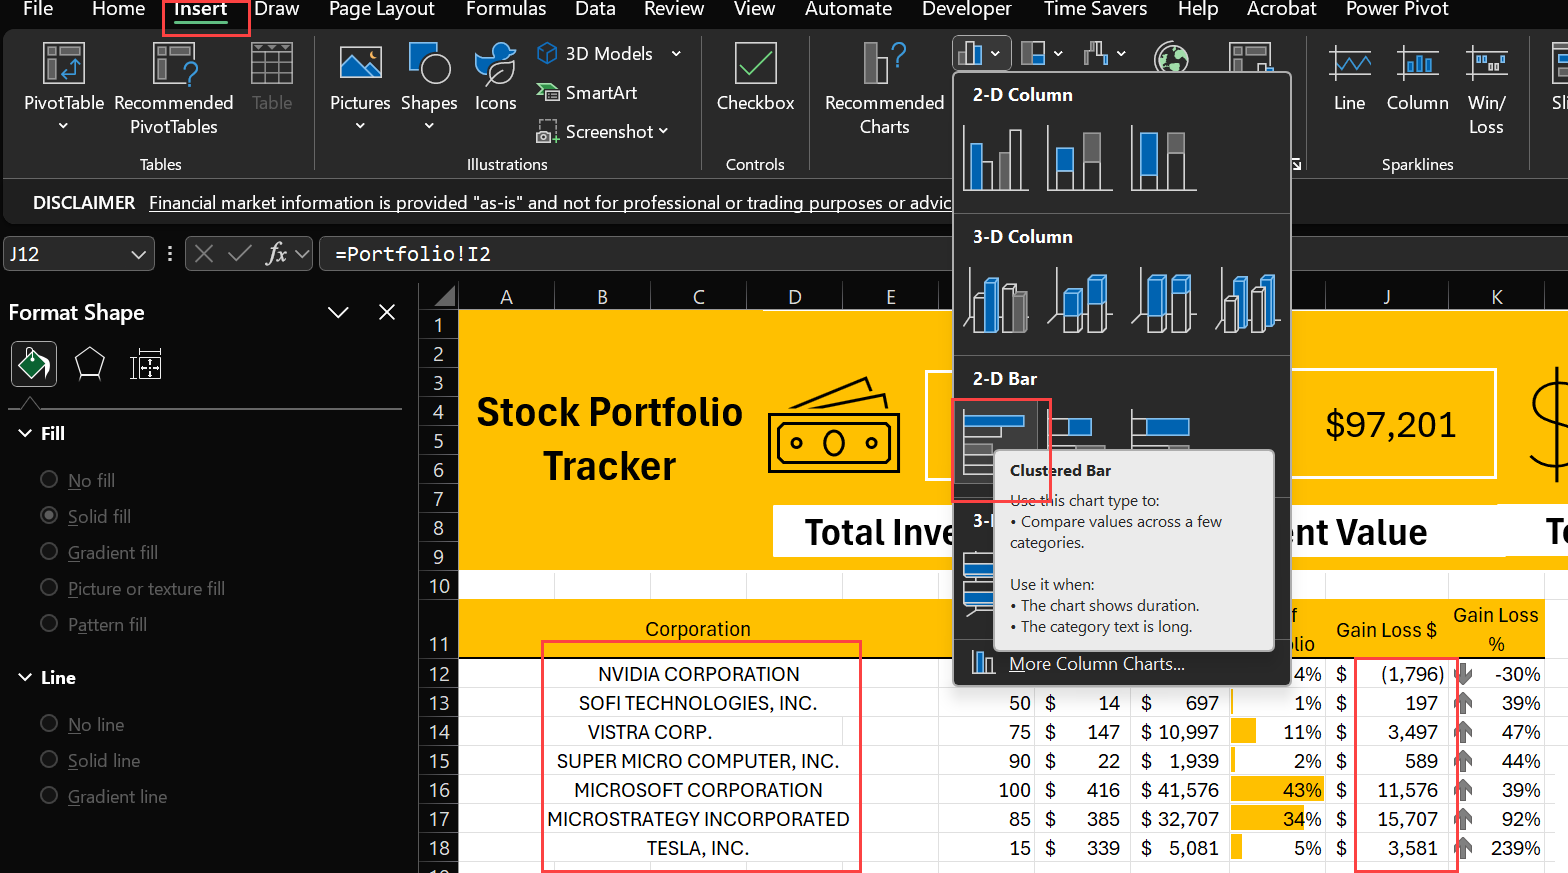
Step 2: Create a Performance Bar Chart
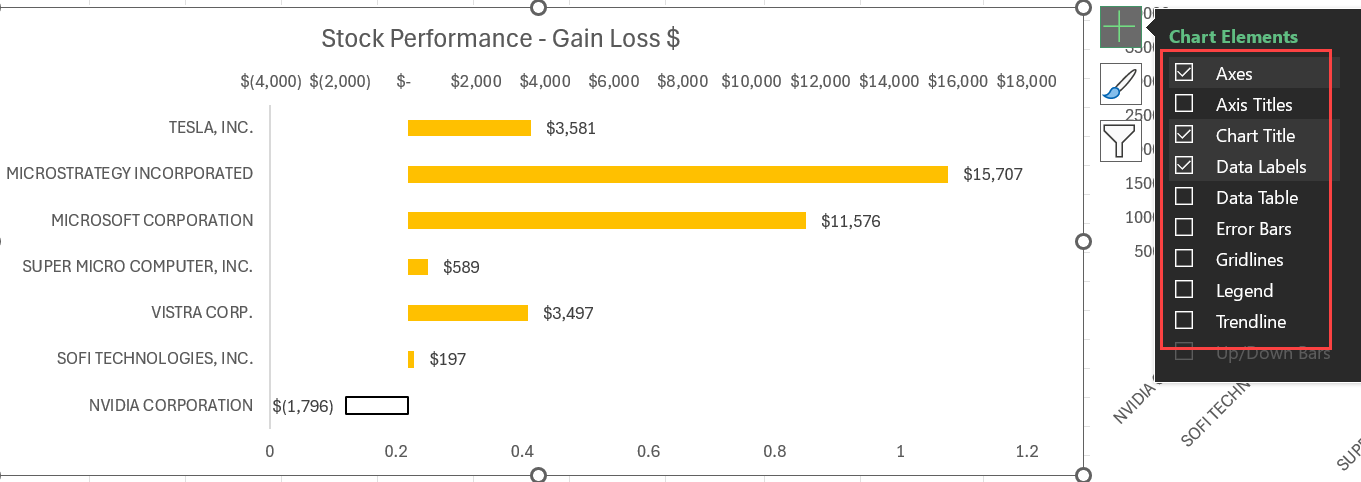
Portfolio data visualization isn’t complete without a performance bar chart that helps you understand your stocks’ value.
1. Create the Basic Chart
See the example below.
See the example below.
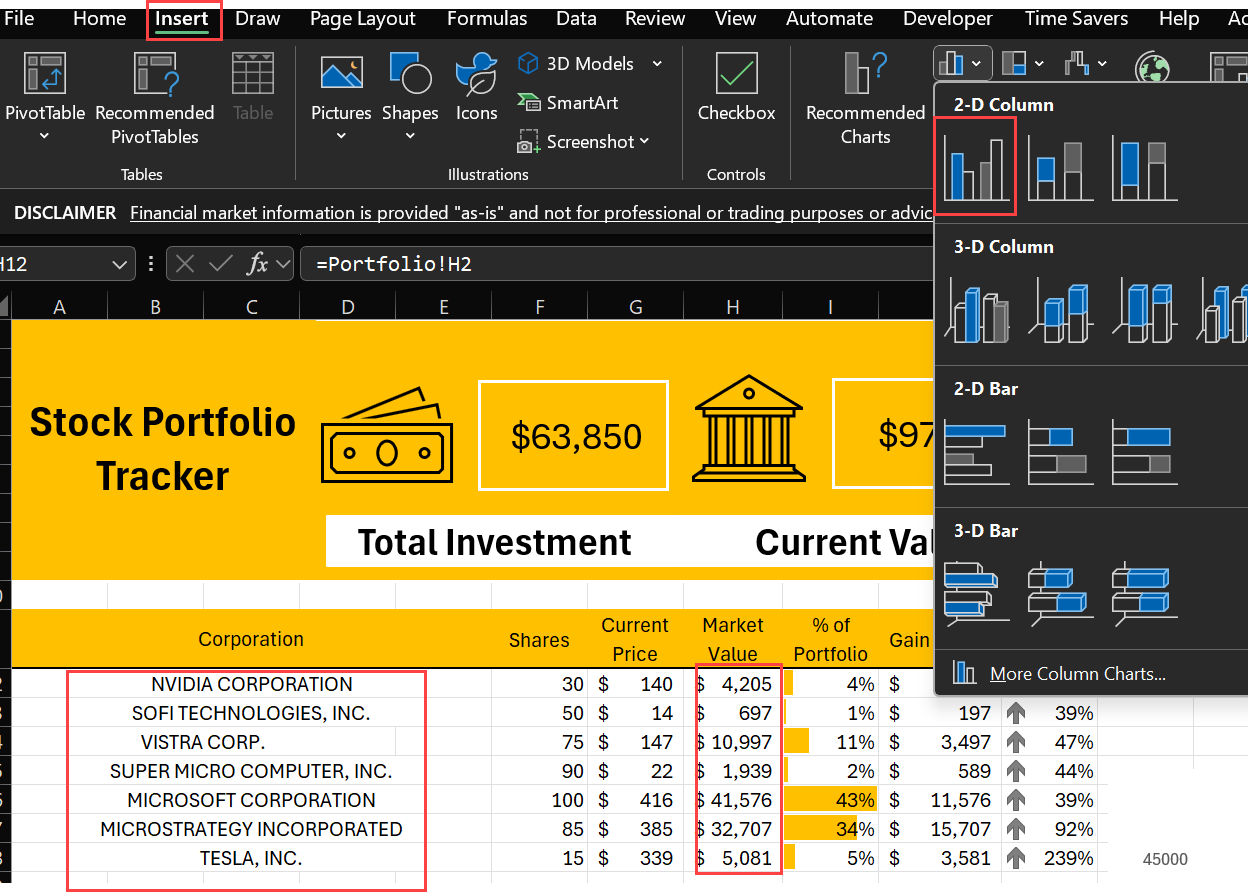
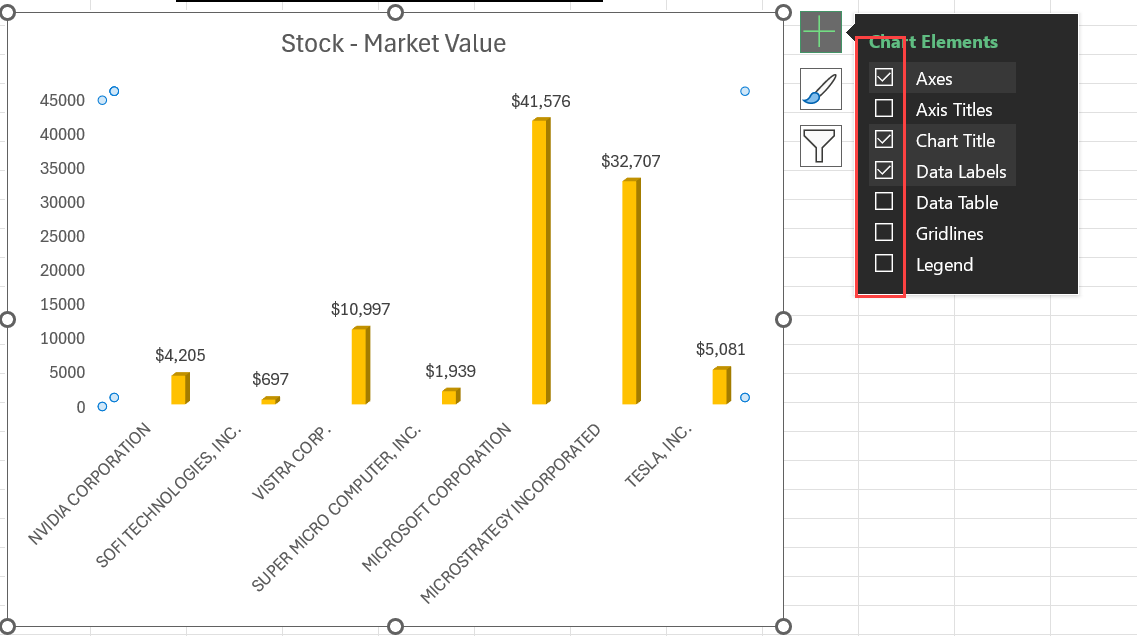
As part of the portfolio data visualization, the Market valuation column chart gives you an easy-to-evaluate view of the value of your portfolio. This chart will help you analyze the individual performance of each stock.
1. To Create the Basic Chart:
For your Excel stock portfolio tracker to support your stock tracking it needs to meet this criteria: it must update automatically.
This part of building your Excel stock portfolio tracker is what turns a typical stock tracker spreadsheet into a real-time stock tracker app.
This final phase of the process is only a two-step process. We’ll dive into how you can turn your stock portfolio tracker Excel spreadsheet into a live portfolio with plenty of visual aids.
Step 1: Add Refresh Menu
1. Go to Insert > Shapes > and Insert a rectangle shape.
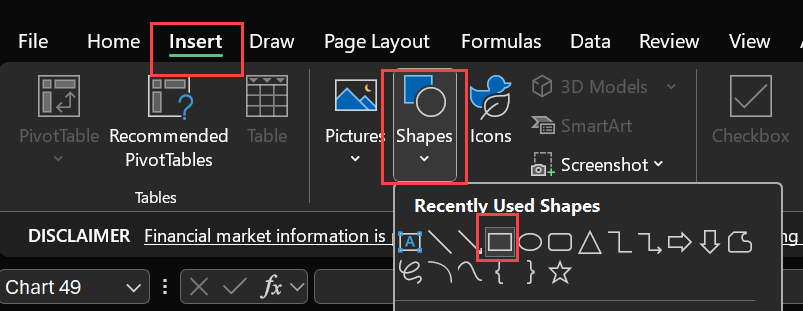
2. Add a text box and include the text ‘Refresh’
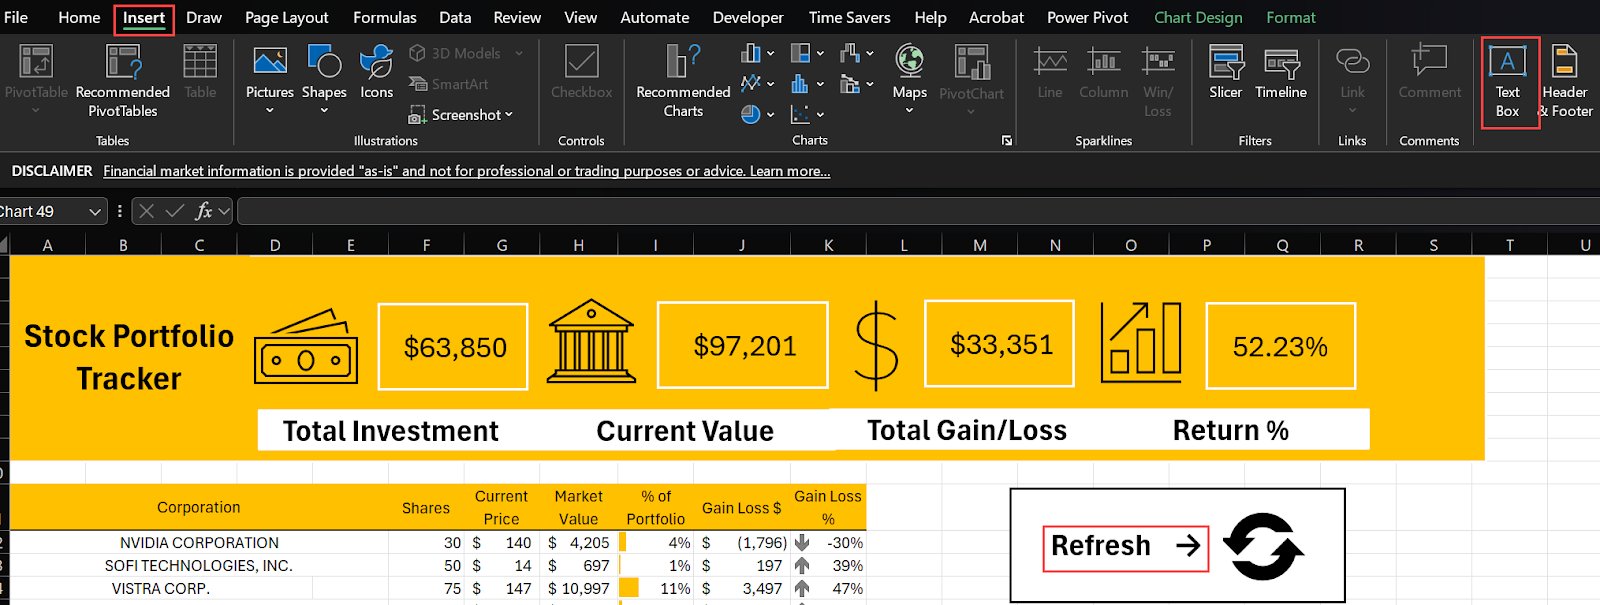
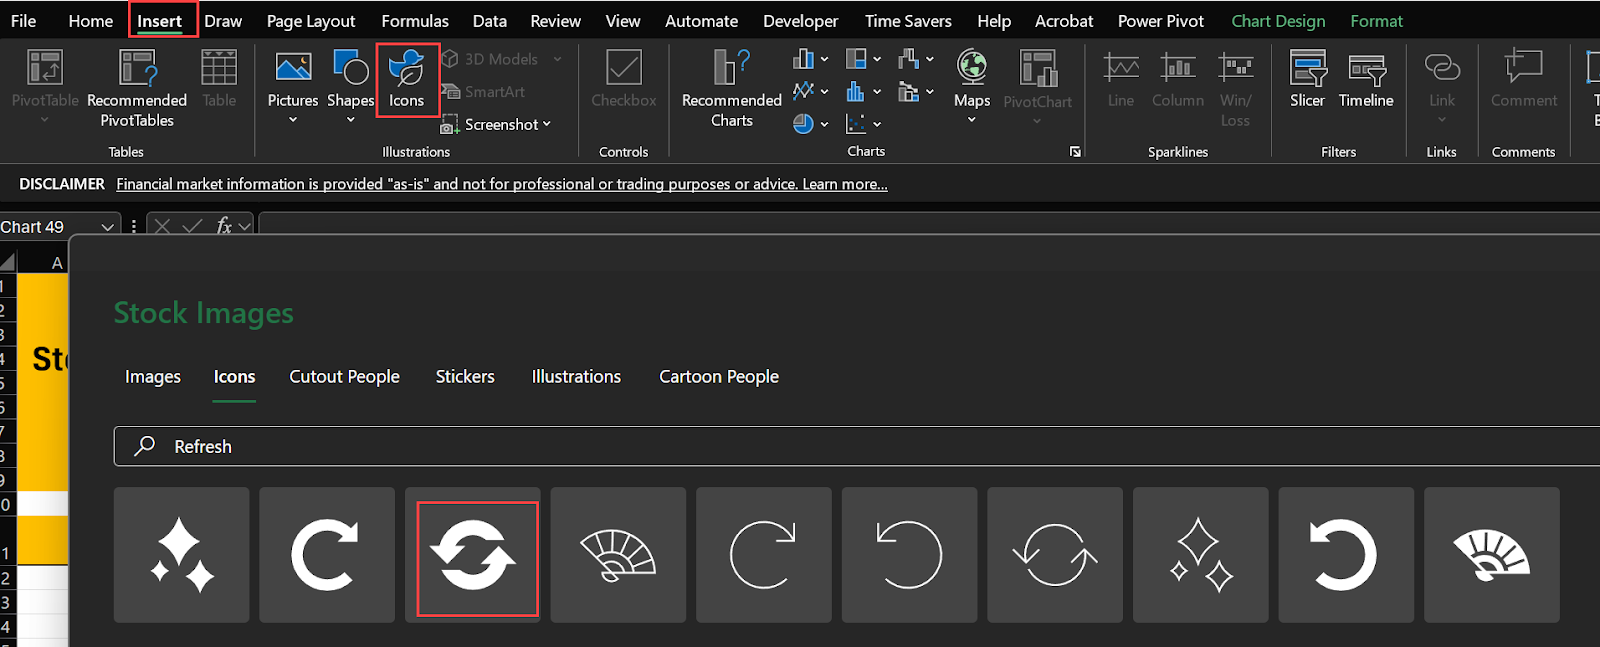
Step 2: Add Refresh Button
1. Create the Button:
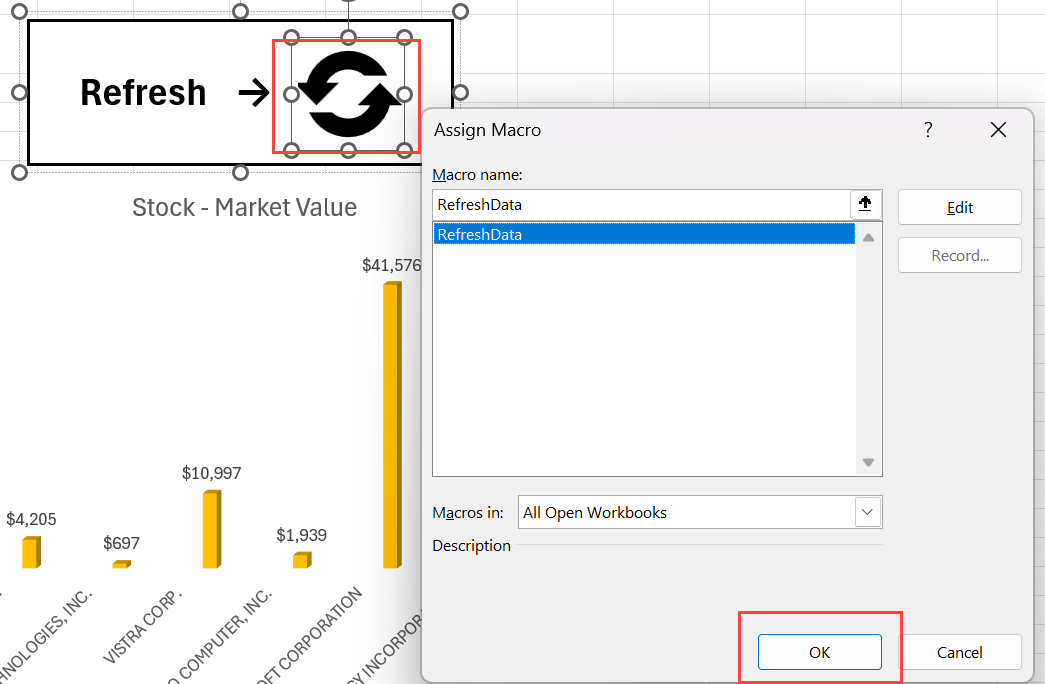
2. Add VBA Code:
Remember VBA code is case sensitive, so to ensure you’re avoiding a return false result, we suggest you follow this step carefully.
Sub RefreshData() ActiveWorkbook.RefreshAll End Sub 
You don’t need to be an expert in Excel that understand logical tests, multiple conditions, test scores, mathematical operators, text strings, or syntax.
By following this comprehensive guide, you will have created a powerful Excel stock portfolio tracker that rivals expensive paid solutions with real-time updates, automated calculations, and professional dashboards. Whether you’re tracking a few stocks or managing a diverse portfolio, you now have the essential tools to monitor your investments effectively and make data-driven decisions based on clear visualizations and accurate performance metrics.

92% of students automate workflows, build CEO-ready dashboards, and streamline collaboration in < 1 hour. Don’t miss out!
🎯Master every Office 365 tool like Excel, Word, PowerPoint, Teams, Outlook and OneNote.
🎯Streamlined approach—no fluff, just rapid skill-building.
🎯Eliminate tedious tasks with intelligent automation.
🎯Transform everyday workflows into strategic power moves.
🎯Boost productivity and impress every boss.
🎯Real-World Projects – directly translate lessons into workplace wins.