Master Power Query data transformations with this comprehensive guide on Transpose, Pivot, and Unpivot functions, which are essential for data analytics. With step-by-step tutorials, learn how to reshape Excel data efficiently. Perfect for data analysts and Excel power users.
by Mihir Kamdar / Last Updated:
After reading this guide, you’ll be equipped with the knowledge to:
Download our step-by-step tutorial file now by clicking on the icon below and follow along to enhance your Excel skills practically and efficiently!
Need to reshape your data like a pro? Power Query’s transformation tools are here to help! Users can efficiently edit documents using Power Query. Let’s explore three powerful ways to restructure your data: Transpose, Pivot, and Unpivot.
Signing in with a free Microsoft account allows users to access Power Query features on smaller devices.
With robust formatting tools in Power Query, users can seamlessly transform and clean data for advanced reporting. Excel’s modern templates, when combined with Power Query, simplify complex data tasks, offering dynamic and customizable solutions.
Power Query allows users to prepare data efficiently, making it easier to edit chart labels in Excel for clear visualization. Power Query integrates seamlessly with data from a third party app publisher, enabling users to clean and transform external data sources effectively.
Mastering the ability to unpivot, pivot, and transpose in Excel is crucial for efficient data transformation and analysis. With Power Query, Excel users can perform these actions effortlessly. Unpivot is ideal for restructuring wide, column-based data into tall, row-based data for better analysis and reporting.
On the other hand, Pivot reshapes row-based data into a concise, column-oriented format, enabling the creation of summary tables and cross-tabulations. Transpose, another powerful tool, flips data by turning rows into columns or vice versa, providing a fresh perspective on the dataset. With step-by-step instructions, Power Query simplifies these processes, making it accessible even to beginners. These features ensure accurate and efficient data analysis, helping users streamline workflows and visualize complex datasets effectively.
Power Query in Excel offers amazing transformation techniques that allow users to reshape and analyze data more effectively. By using functions like unpivot, pivot, and transpose, you can transform data to fit your specific analysis needs. For instance, unpivot takes column based data and converts it into a more manageable row based format, which streamlines the analysis process. This is ideal when you want to restructure your data into a normalized format for better reporting and visualization.
Using Power Query, you can also combines data from multiple sources, simplifying complex tasks. With the right column names, you ensure that the data’s format remains intact throughout the transformation process. Whether you’re working with sales data or any other dataset, transforming value columns into rows or columns allows you to gain fresh insights and improve decision-making.
When applying the pivot function, row based data is reorganized into concise columns, making it easier to create resulting pivot table that summarizes your data. This helps you visualize trends and patterns in the data efficiently. For example, after applying the pivot transformation, you can create pivot table to analyze sales data, which are invaluable for reporting. Power Query’s ability to reshape datasets, like flipping data with the transpose function, allows you to view the data from new perspectives, facilitating better data analysis.
Power bi desktop is a powerful tool that allows users to connect, transform, and visualize data efficiently. After applying the transformations, the following table presents the reshaped data for easy analysis and reporting. By using these tools effectively, you can create more dynamic and structured datasets, enabling impactful reporting and chart creation. Overall, mastering unpivot, pivot, and transpose in Excel’s Power Query is essential for anyone involved in data transformation and analysis.
Power Query is a powerful data analysis tool embedded within Microsoft Excel, designed to help users import, transform, and analyze data from a variety of sources. Whether you’re pulling data from databases, web pages, or files, Power Query simplifies the process, making it accessible even to those who aren’t data experts.
This tool is indispensable for anyone involved in data analysis and visualization, and it’s widely used across industries such as finance, marketing, and healthcare. With Power Query, you can streamline your data workflows and gain deeper insights with ease.
Power Query simplifies financial analysis by allowing users to transform and organize complex datasets for better insights. Power Query functionality remains accessible during the current subscription period of Microsoft Excel or Office 365.
With Power Query, you can clean and reshape data with just a few taps, saving time and effort in Excel. Third-party app integrations with Power Query often include a separate privacy statement to ensure data security and compliance.
While Power Query focuses on data transformations, Excel allows users to create shapes for enhanced data presentation and visualization.

What is Transpose?
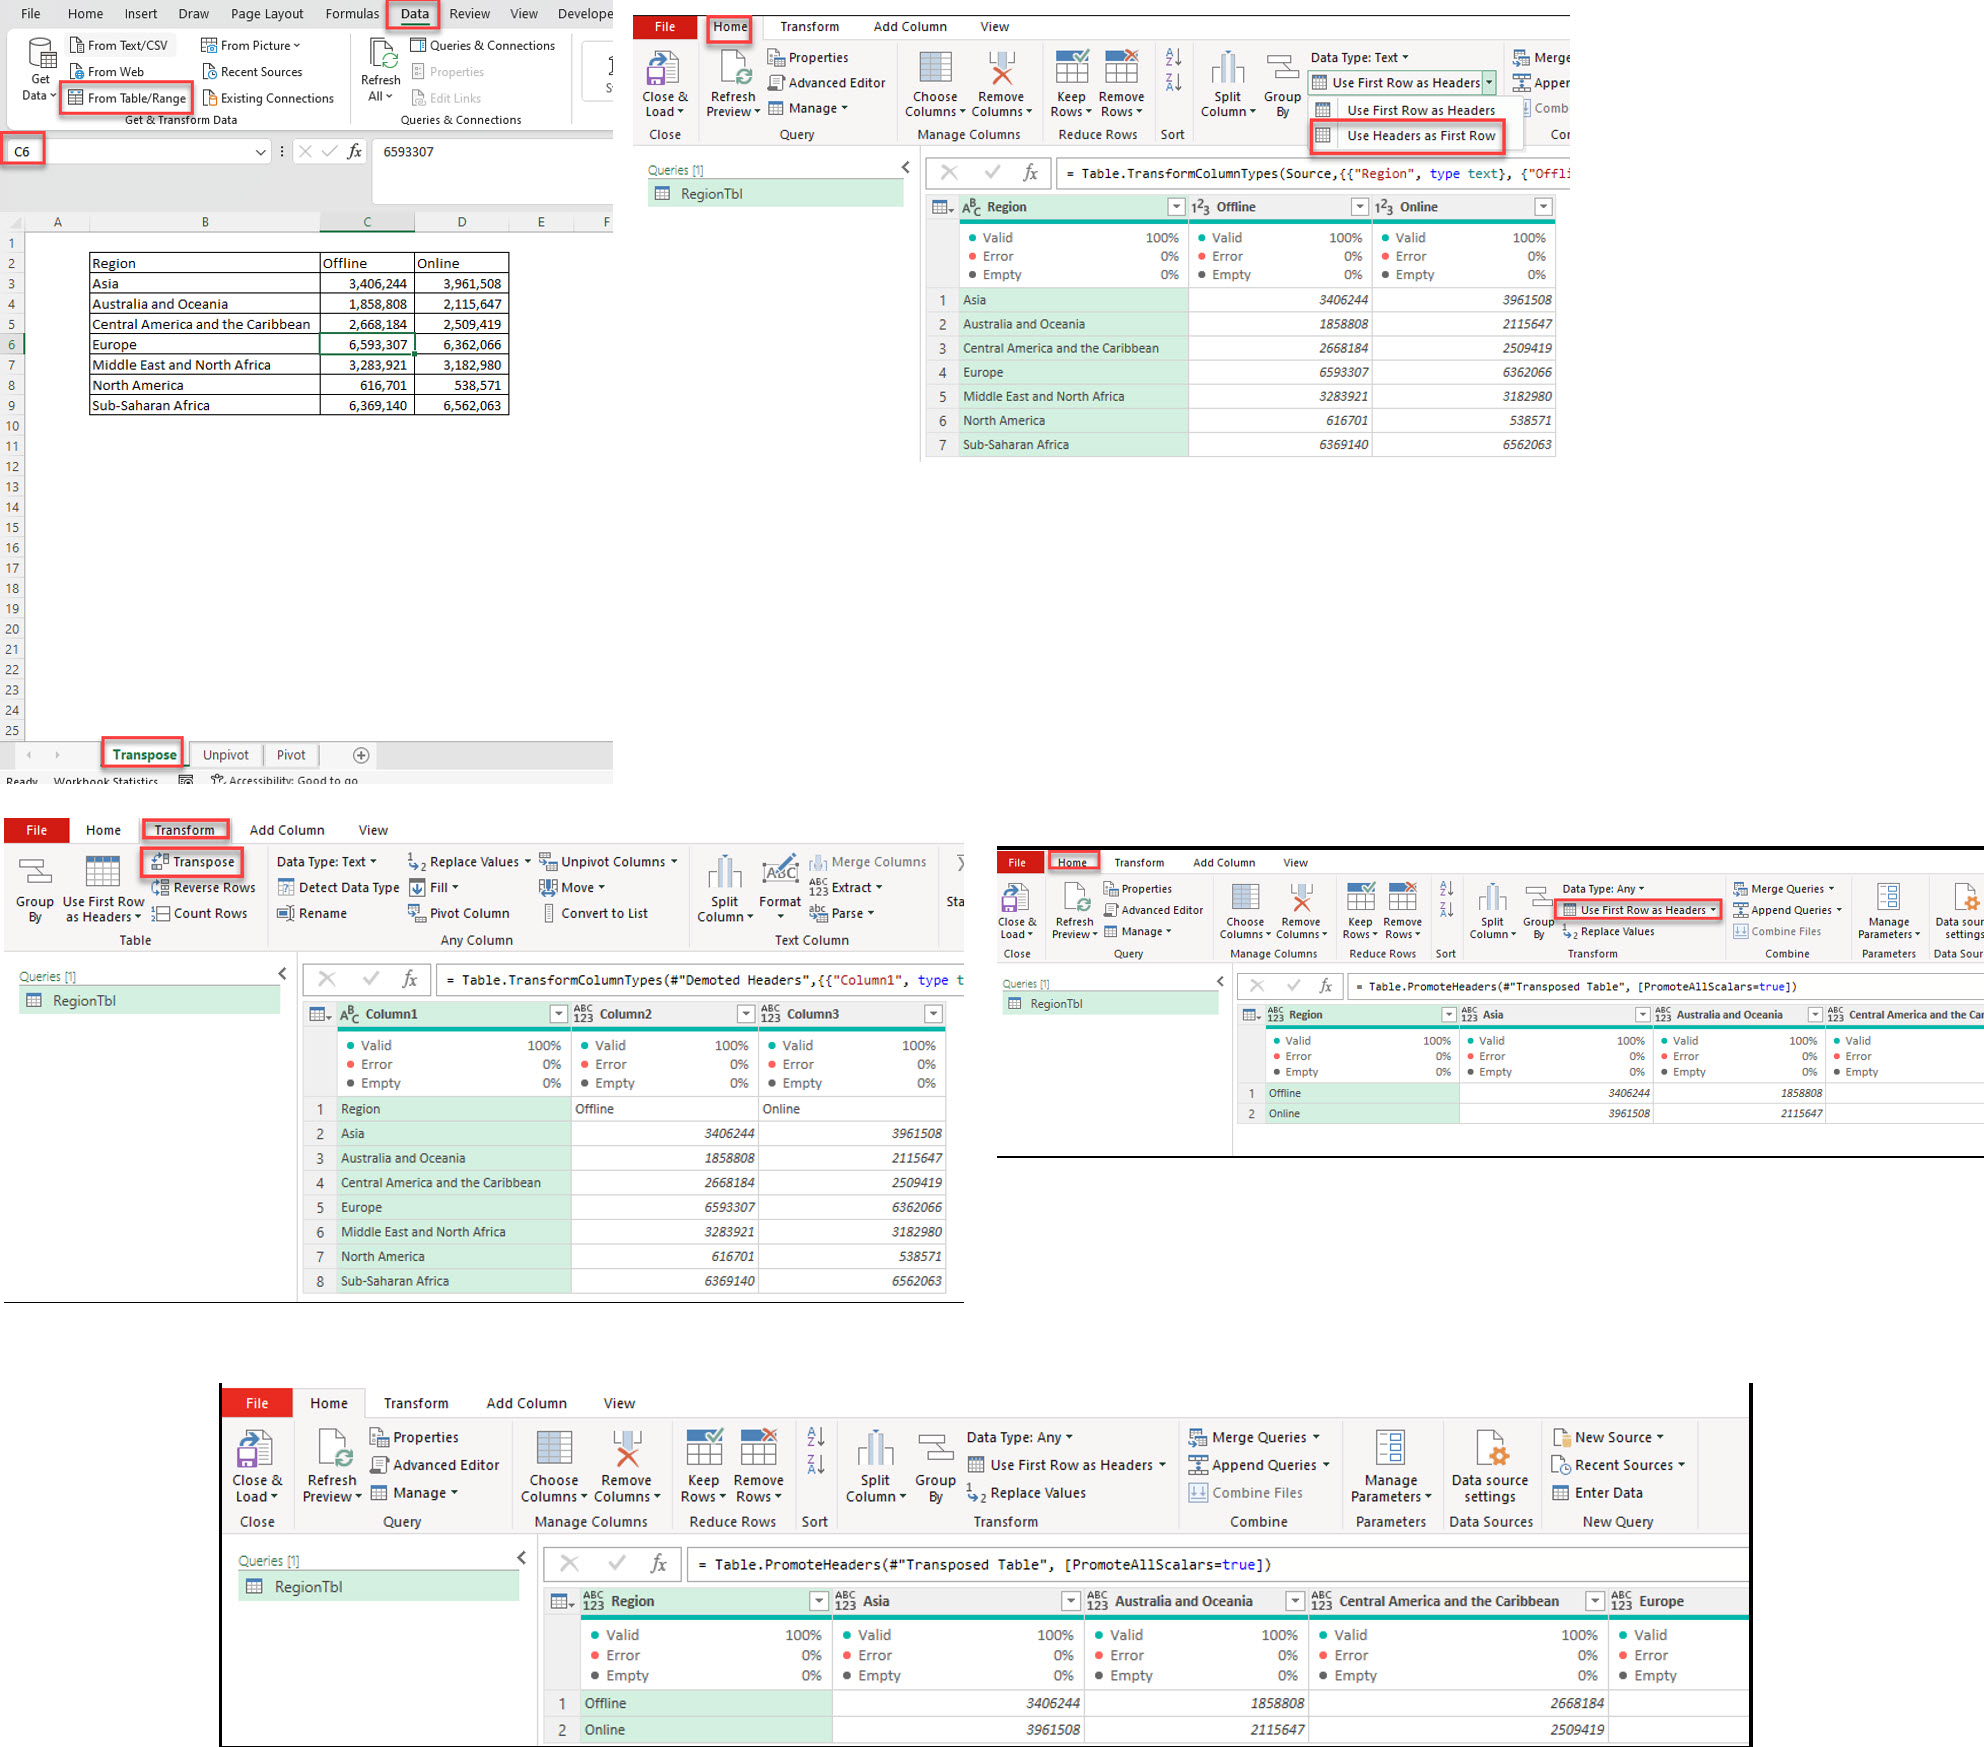
Think of transpose as flipping your data like a pancake – rows become columns, and columns become rows. Perfect when you need to change your data’s perspective!
Step-by-Step Guide:
Start the Process:
In Power Query Editor:

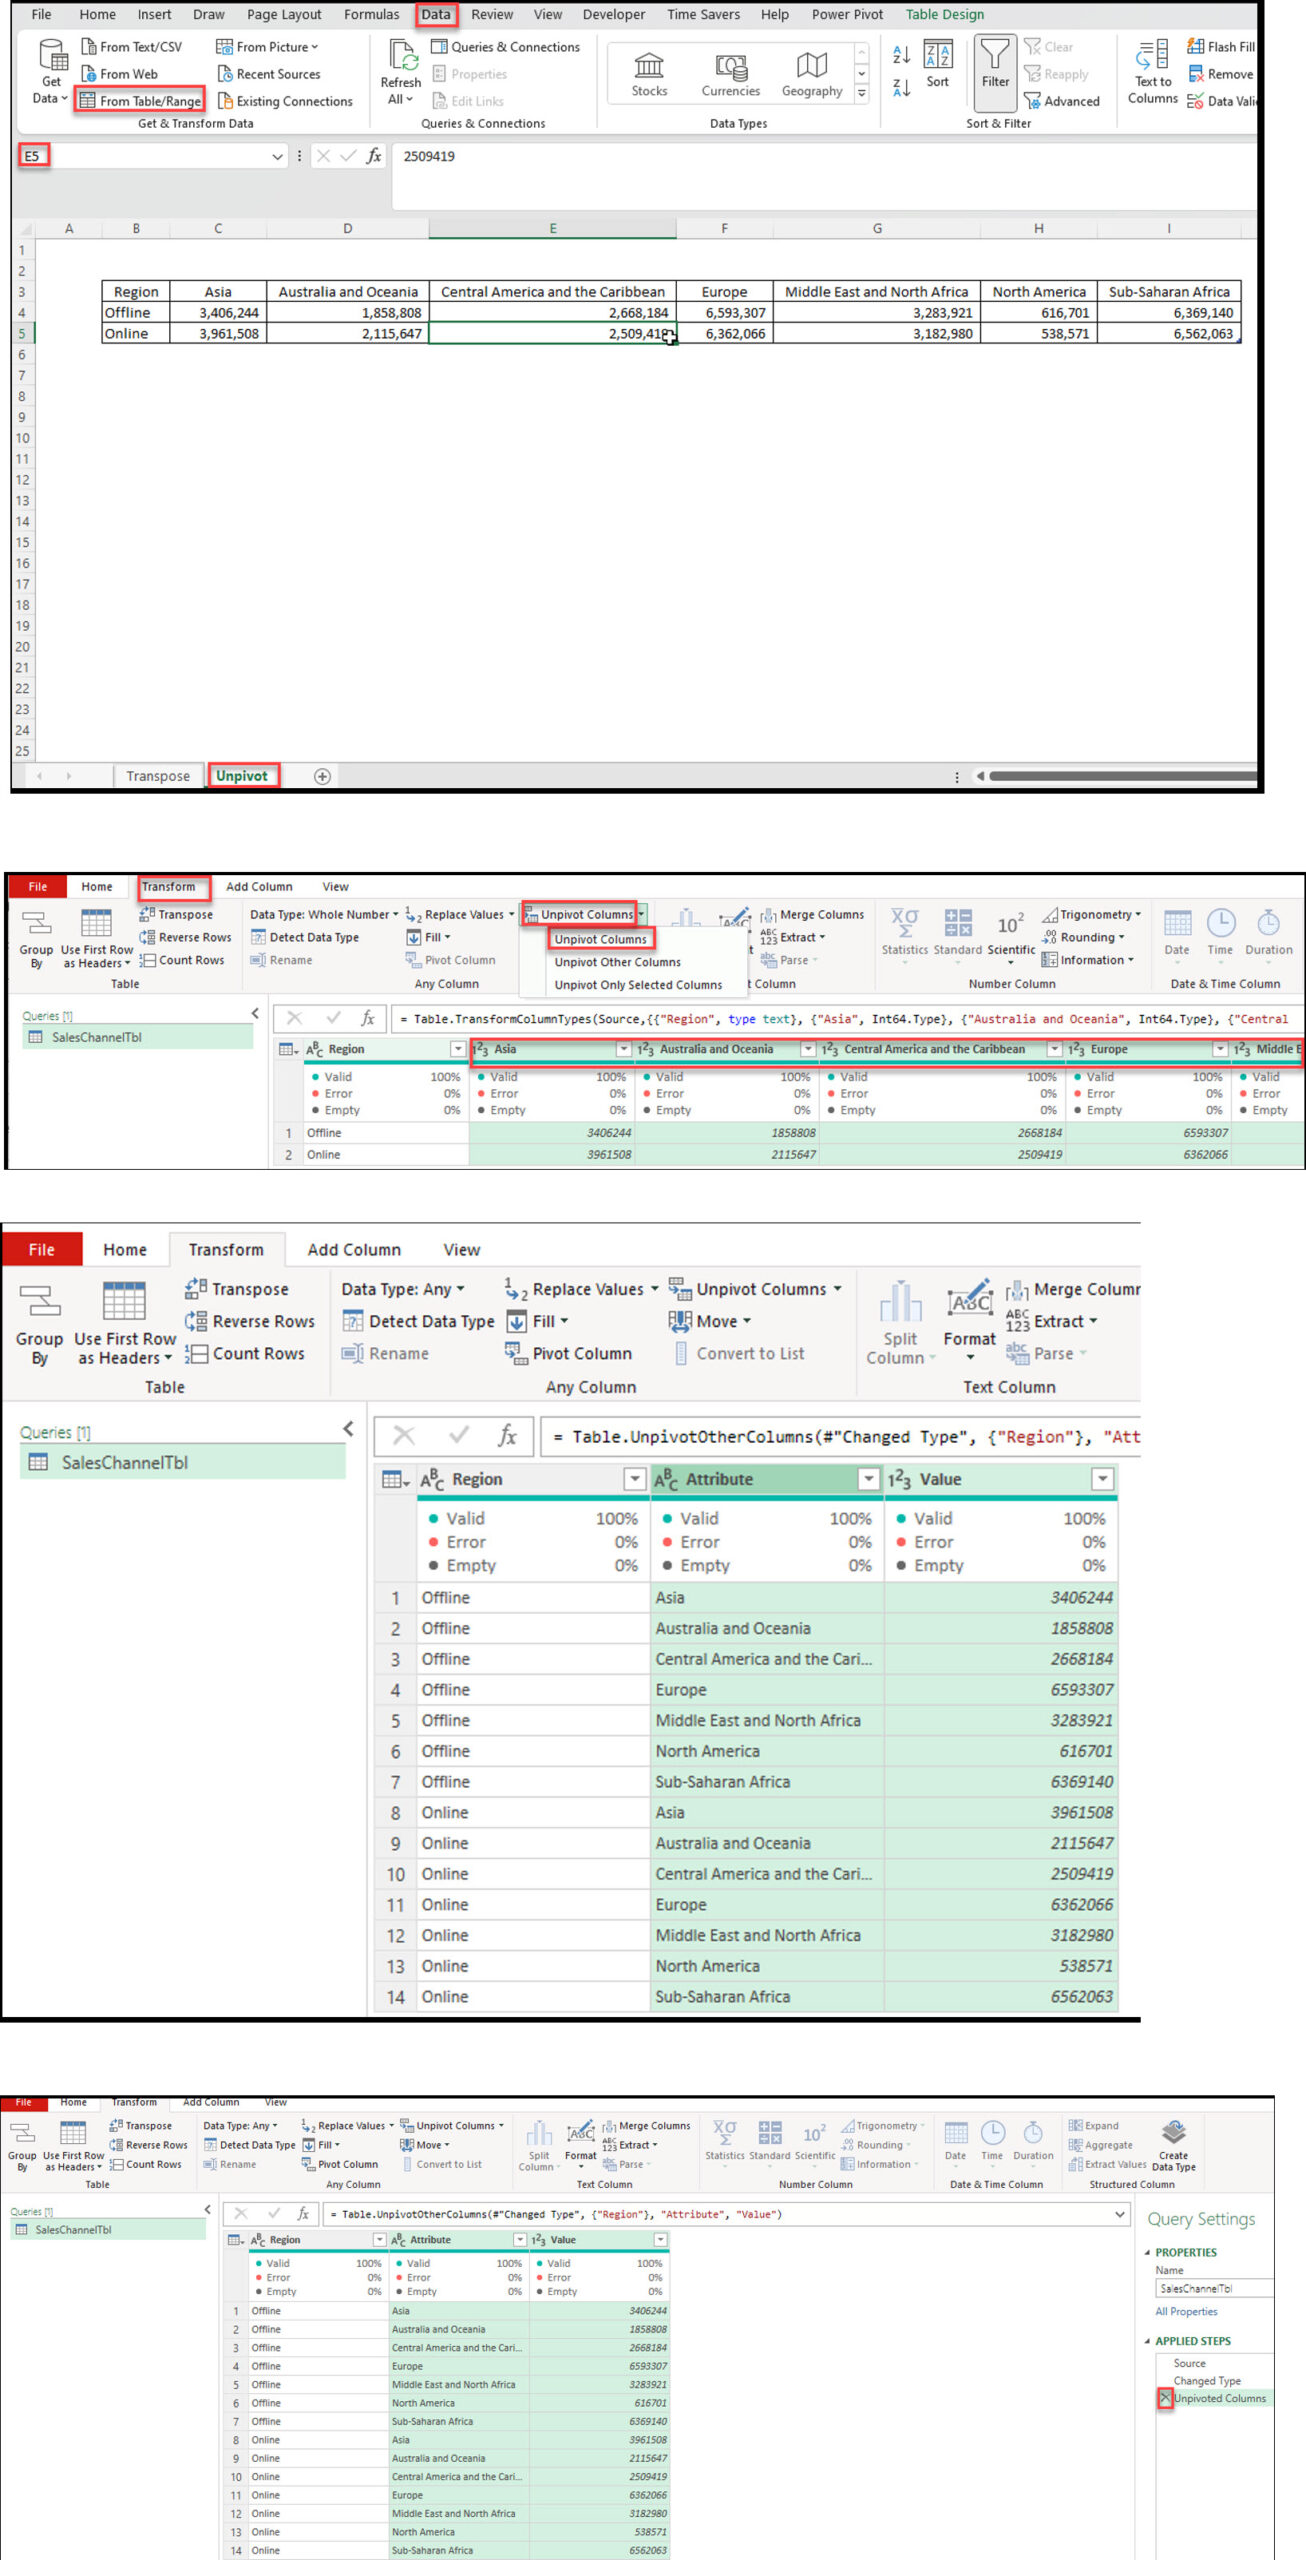
Unpivot is like taking wide data and making it tall. It converts multiple columns into rows, perfect for analysis and reporting
How to Unpivot:
Select Your Data:
In Power Query:

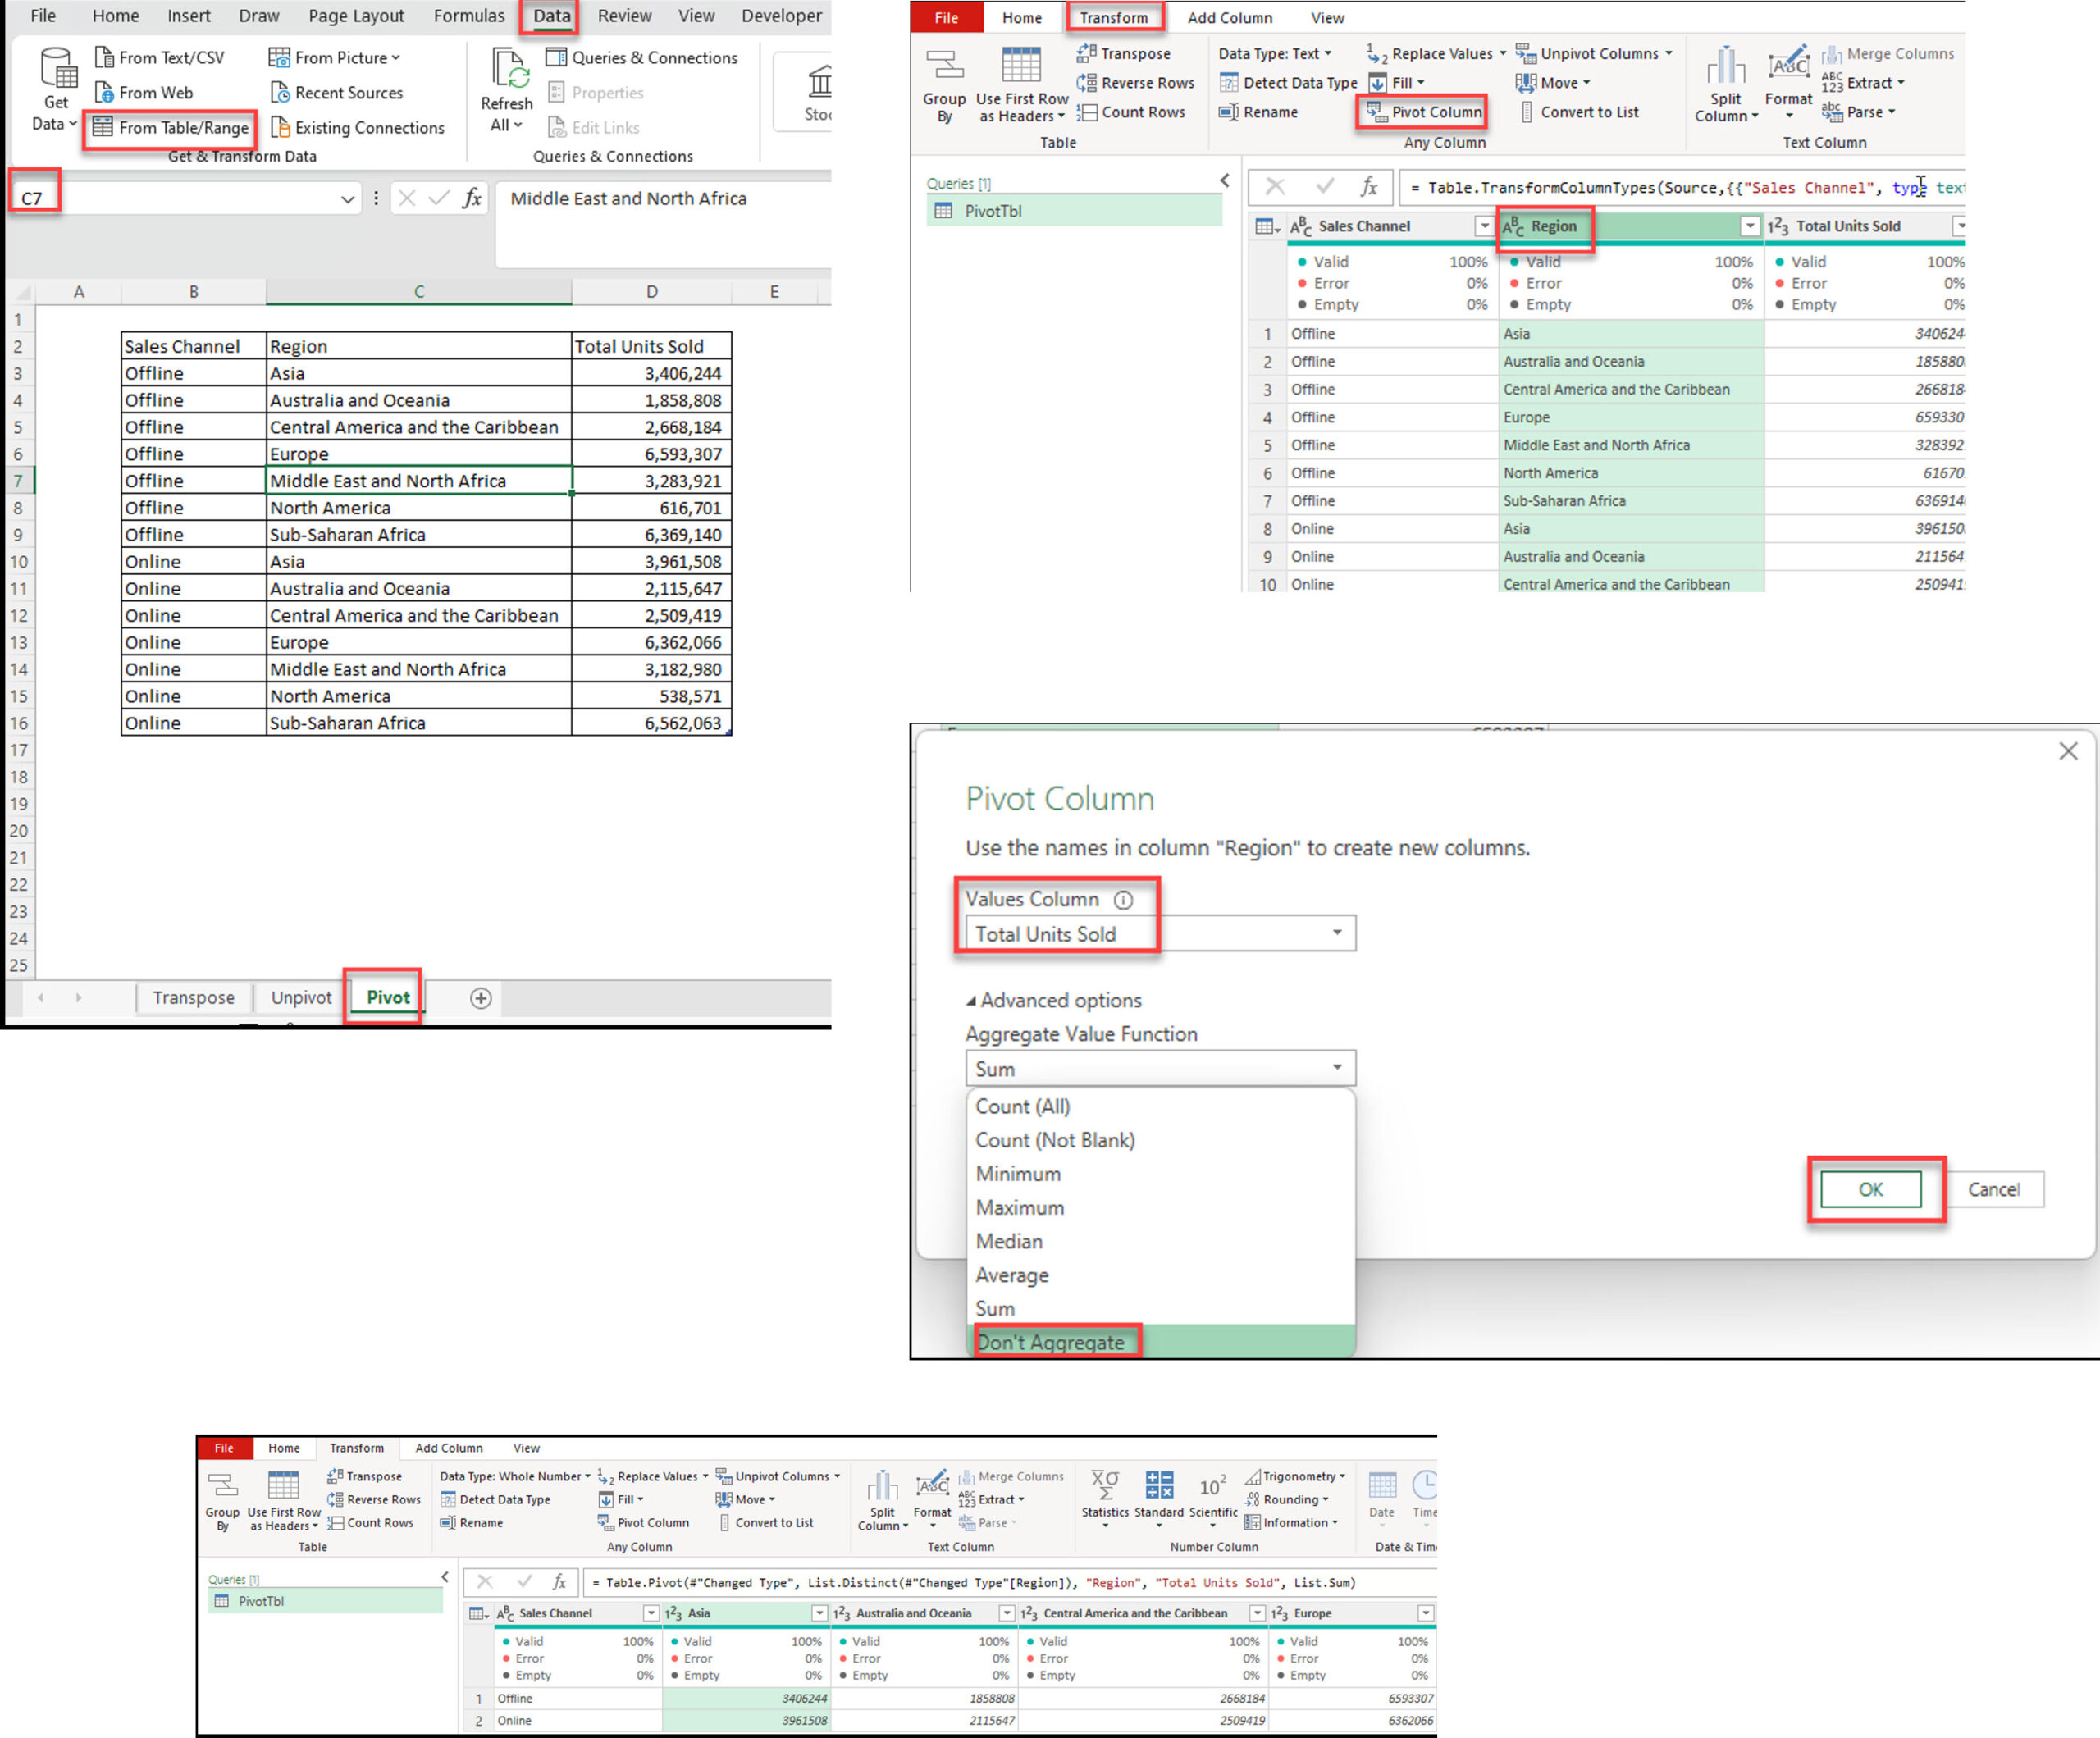
Step-by-Step Pivot: Highlight Key Insights
Initial Setup:
In Power Query:

Transpose rotates the entire table, turning rows into columns and vice versa. Unpivot converts multiple columns into rows, creating a more normalized data structure.
Select “Transform” tab, then click “Transpose” in the ribbon
Column headers are lost during transposition. The new columns are named “Column1”, “Column2”, etc.
Select the columns you want to keep as-is, then choose “Unpivot Other Columns” from the “Transform” tab.
“Unpivot Columns” unpivots selected columns, while “Unpivot Other Columns” unpivots all columns except the selected ones.
Yes, you can pivot data using the “Pivot Column” option in the “Transform” tab.
These Power Query transformations are like having a data reshaping Swiss Army knife. Practice with your own data, and you’ll be reshaping data like a pro in no time! It enhances data analysis efficiency, helping service providers maintain facilities with accurate and structured information.
Power Query can help users create charts for better data visualization, making it easier to interpret complex data. Additionally, Power Query is useful for managing personal finances through effective data analysis, aiding in budgeting, expense tracking, and financial planning.

92% of students automate workflows, build CEO-ready dashboards, and streamline collaboration in < 1 hour. Don’t miss out!
🎯Master every Office 365 tool like Excel, Word, PowerPoint, Teams, Outlook and OneNote.
🎯Streamlined approach—no fluff, just rapid skill-building.
🎯Eliminate tedious tasks with intelligent automation.
🎯Transform everyday workflows into strategic power moves.
🎯Boost productivity and impress every boss.
🎯Real-World Projects – directly translate lessons into workplace wins.