Whether you’re stepping into Excel for the first time or looking to sharpen your skills, this Excel Mastery guide is designed to take you from basics to brilliance. From navigating the interface to mastering data organization, formulas, and shortcuts, you’ll learn to tackle any spreadsheet with confidence. Get ready to transform raw data into valuable insights and take your productivity to new heights with this all-in-one Excel guide! In this article, you will learn How to Use Excel as a beginner.
by Mihir Kamdar / Last Updated:
If you read this guide, you will learn the whole of Excel. Here’s what we’ll cover in detail:
Download our step-by-step tutorial file now by clicking on the icon below and follow along to enhance your Excel skills practically and efficiently!
The most used application across industries is Microsoft Excel, which has features that are comparable in data management, analysis, and reporting. This is a complete, in-depth guide to Excel, covering the basics for beginners and the more advanced for experienced users. This will give you a complete understanding of Excel’s structure, ways to manipulate data and the capabilities of the formula.
Excel is a powerful tool for data management and analysis, and there are many resources available for beginners to learn how to use it effectively. If you’re starting your Excel journey, there are various online courses, tutorials, and training programs designed specifically for beginners. These resources will guide you through the basic functions, such as data entry, formatting, and creating simple calculations.
For those looking for structured learning, Excel training for beginners online and Microsoft Excel training for beginners offer comprehensive lessons that cover key topics, including formulas and functions. Free Excel courses for beginners and free Excel tutorial for beginners are also excellent options if you prefer a self-paced, no-cost approach to learning.
Learning Excel for beginners often starts with understanding the basics, such as the interface, how to enter data into cells, and performing simple operations. As you progress, you’ll encounter more advanced features like pivot tables, VLOOKUP, and data visualization, which are crucial for data analysis.
To make your learning even more practical, many online platforms offer Excel exercises for beginners, allowing you to practice what you’ve learned. Whether you choose a free or paid course, mastering Excel basics for beginners will equip you with the skills to work efficiently with spreadsheets and make the most of this powerful tool.
Excel for beginners can be an exciting journey, as there are many resources available to help you get started. Whether you prefer online Excel training for beginners or a structured Excel course for beginners, you’ll find plenty of options to suit your learning style. For those who like self-paced learning, an Excel tutorial for beginners or free Excel for beginners PDFs provide step-by-step guidance. Additionally, Excel classes for beginners are ideal for those who prefer hands-on learning with an instructor. With these tutorials and courses, you’ll be able to quickly grasp the basics and enhance your Excel skills in no time.
Excel organizes data and workflows using a structured environment consisting of workbooks, worksheets, cells, and ranges. Understanding these components helps to manage and navigate data more effectively.
Each component within Excel has unique capabilities that support various tasks, from data entry to advanced analysis.
Mastering the basic operations of opening, saving, and printing workbooks is essential for efficient work in Excel.
1. Opening a Workbook
For a new workbook, navigate to File > New > Blank Workbook.
For existing workbooks, go to File > Open and browse your files. Excel supports various formats, such as .csv (for single sheets) and .xlsx (preserving multi-sheet structure and functionality).

2. Closing a Workbook
Close a workbook by clicking the “X” icon at the top-right corner or selecting File > Close. If you haven’t saved changes, Excel will prompt you to do so, preventing accidental data loss.
3. Saving a Workbook
Use Ctrl + S or the Save icon on the Quick Access Toolbar for regular saves.
To save a workbook with a new name, select File > Save As, and specify the new name and location. Excel allows saving as .xls, .xlsx, .csv, and other formats for different use cases.


4. Printing a Workbook
To print, go to File > Print, which opens a print preview. Adjust settings like page orientation, margins, or print area to ensure data fits well. Use the print preview to catch formatting errors, especially for large data sets, so that your printouts maintain clarity and legibility.
Excel has built-in tools for recovering unsaved files and restoring previous file versions, which helps avoid data loss and recover from accidental deletions.
Recover Unsaved Workbooks
If you close Excel unexpectedly, you can access unsaved files by selecting File > Info > Manage Workbook > Recover Unsaved Workbooks. This feature lists recent unsaved files, allowing you to open and save them.

Recover Previous Versions
To view older versions of a file, go to File > Info > Manage Workbook > Version History. Here, you can access previous states of your workbook, which is helpful if you accidentally make unwanted changes and need to revert.
These features are lifesavers, especially for critical files and preventable data loss situations.
Excel templates are pre-designed spreadsheets that provide a starting point for various tasks, such as budgeting, project management, and scheduling.
Templates streamline tasks, improve accuracy, and make it easier to maintain a standardized format across similar projects.


Excel’s extensive shortcut list enables you to work faster, especially when performing data entry or formatting repeatedly.
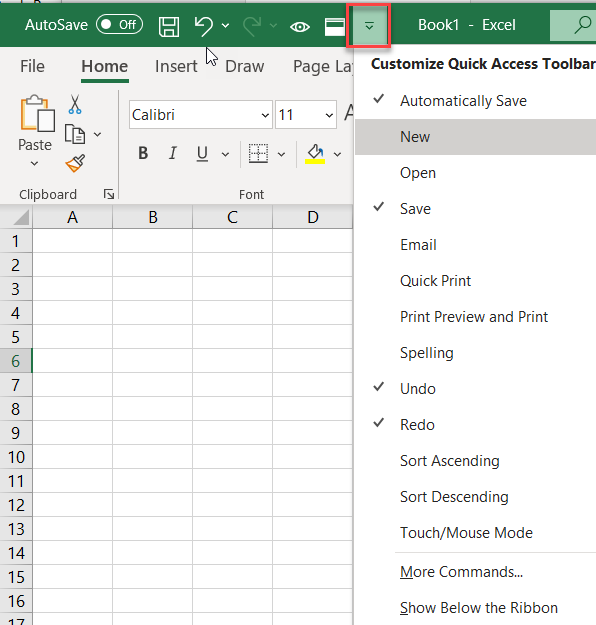
Customizing the Ribbon and Quick Access Toolbar saves time by organizing tools according to your workflow needs, which can significantly boost productivity.
Knowing the correct data type for each task is crucial for accuracy in calculations and data processing.
Properly setting data types prevents calculation errors and enables Excel to format and process data as intended.
Accurate data entry is fundamental to Excel’s functionality, and Excel provides tools to streamline the process.
Mastering these entry methods ensures data accuracy and saves time during repetitive tasks.
Managing data within cells involves modifying, deleting, replacing, and annotating content effectively.
These functions enable easy data management, ensuring clarity and supporting team collaboration with comments and notes.
Formatting improves the readability and professional appearance of data.
Consistent formatting enhances the presentation, making data clear and visually appealing.
Worksheets are where data entry, calculations, and analysis happen. Being able to add, delete, and rename sheets makes it easier to organize your workbook by categorizing information and workflows.
These actions help keep your workbook organized, making it easier to find relevant data and maintaining a clear structure.

Color-coding worksheet tabs is an easy way to differentiate various parts of a workbook visually. For instance, you might use blue tabs for data sheets and green tabs for summary sheets.
Using colors for different types of data or tasks improves workbook navigation and helps you locate relevant sheets at a glance, especially in extensive workbooks.
Rearranging worksheets allows you to place related sheets near each other or to set a logical flow from raw data to summaries or reports.
Organizing worksheets helps maintain order in large workbooks, enhancing ease of access and workflow continuity.
Hiding worksheets is useful for data organization and maintaining privacy within shared workbooks.
Hiding and unhiding sheets keeps your workbook clean and reduces visual clutter, particularly when dealing with sensitive or rarely used data.
Zooming helps adjust the view of your worksheet to see more or less data at once.
Adjusting zoom levels allows you to focus on specific data or see an overview of larger datasets, making it adaptable to different working styles.
Viewing the same worksheet in two windows is helpful when working with large datasets, allowing you to compare different sections of the sheet side by side.
This feature is especially useful for reviewing data in one section while entering information or referencing calculations in another.
The Freeze Panes feature keeps specific rows or columns visible while you scroll, making it ideal for large datasets with headers or labels.
Freezing panes ensures that important reference data, such as headers, remains visible while navigating the rest of your sheet.

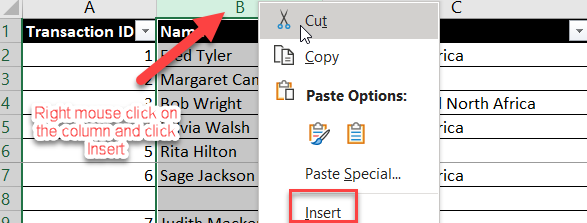
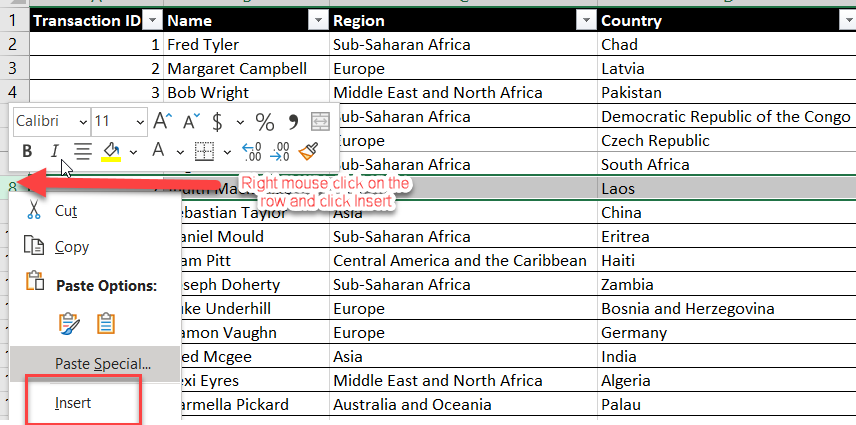
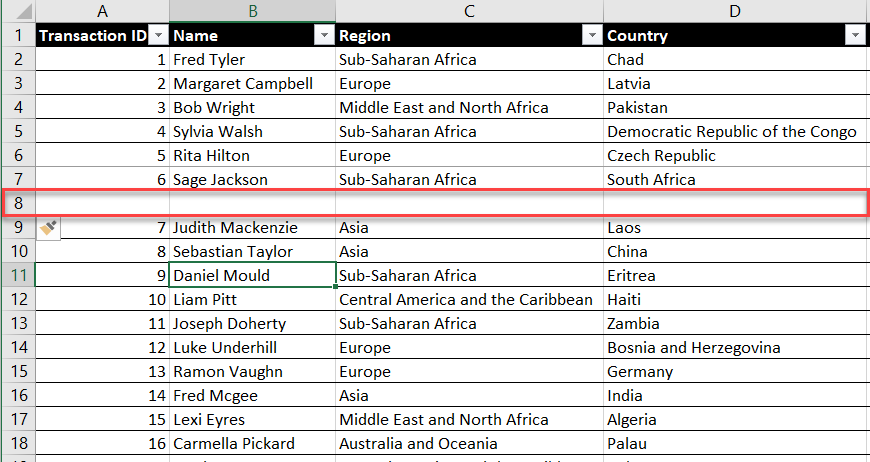
Managing rows and columns is essential for effective data entry and layout customization.
Hiding rows and columns is useful for removing unnecessary data from view without deleting it, keeping workbooks neat and focused.
Formulas enable powerful calculations, making Excel more than just a data-entry tool.
Mastering formulas and functions enables automated calculations, saving time and enhancing accuracy.

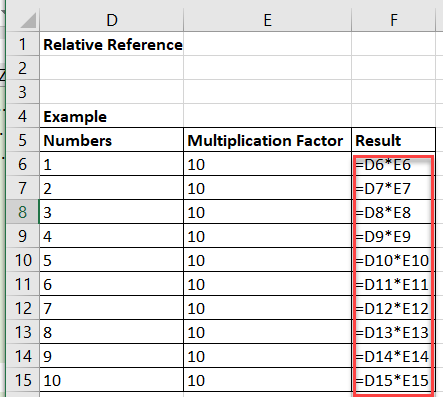
Cell references are the cornerstone of Excel formulas, determining whether cell values remain fixed or adjust as the formula is copied.
Understanding cell references allows for efficient formula replication, making complex calculations scalable and flexible.

You can protect a worksheet by going to Review > Protect Sheet and setting a password. This feature restricts changes to cells, formulas, or data, allowing only authorized users to make edits while others can view the sheet.
To sort data, select the column you want to organize, then go to Data > Sort & Filter. You can sort in ascending or descending order, or apply custom sorting based on criteria like color, text, or numbers.
Save updates the current file with changes, while Save As creates a new copy, allowing you to rename the file or choose a different location or format. Save As is ideal when duplicating files or making backups.
While similar, DAX functions are specifically designed for data modeling, providing more dynamic and advanced calculations.
The Data Tab in Excel provides tools for managing and analyzing data, such as sorting, filtering, importing, and exporting. It also includes advanced options like data validation, text-to-columns, and working with pivot tables.
Beginners should learn basic navigation, data entry, and formatting, as well as functions like SUM, AVERAGE, and VLOOKUP. Understanding sorting, filtering, and creating basic charts is also important.
Key features for data analysis include pivot tables, conditional formatting, data visualization tools (charts), and advanced functions like IF, INDEX, MATCH, and statistical formulas.
Excel is a dynamic tool with a vast range of features, from basic data entry to advanced analysis. This guide covered essential components, data manipulation techniques, and powerful formula applications, all designed to empower you to navigate Excel with confidence and efficiency. Mastering these fundamentals will not only streamline your daily tasks but also unlock Excel’s full potential for data-driven insights and streamlined reporting.

92% of students automate workflows, build CEO-ready dashboards, and streamline collaboration in < 1 hour. Don’t miss out!
🎯Master every Office 365 tool like Excel, Word, PowerPoint, Teams, Outlook and OneNote.
🎯Streamlined approach—no fluff, just rapid skill-building.
🎯Eliminate tedious tasks with intelligent automation.
🎯Transform everyday workflows into strategic power moves.
🎯Boost productivity and impress every boss.
🎯Real-World Projects – directly translate lessons into workplace wins.