Learn how to create, manage, and optimize data models in Excel to streamline analysis and build powerful, data-driven reports
by Mihir Kamdar / Last Updated:
After reading this guide, you’ll be equipped with the knowledge to:
A Data Model in Excel is a way to import, clean and transform data from multiple sources to enable advanced reporting and visualisation. By combining multiple tables into one structure the Excel Data Model makes it easy to analyse large datasets, build relationships between tables and create dynamic reports with tools like Power Pivot. In this article we will cover the basics of data modeling in Excel, the benefits and how to manage it.
Understanding data modeling is crucial for managing and organizing information in any system. When your data model is well-structured, it ensures seamless data flow and supports informed decision-making. But what is a data model, and how does it work? A data model is essentially a blueprint that defines how data is organized, related, and accessed. Questions like “what is a data models” or “what is model data” often arise when exploring how structured frameworks differ from raw data. By learning to model the data, businesses can simplify complex systems, making them easier to manage and analyze.
To truly understand what is data modeling, one must explore its methodologies. It involves the creation of structured frameworks that define relationships between data points. The data model definition varies depending on the system, but the primary goal is consistency and scalability. Professionals often focus on how to define data model structures to ensure clarity and accuracy. If you’re wondering “what is data model” or need practical data model examples, think about applications like eCommerce databases or healthcare systems that align data with business processes.
A data model is a conceptual blueprint that defines the structure and organization of data within a database or data warehouse. It outlines how data is stored, organized, and related, providing a framework for understanding the interactions between different tables and fields, often represented as a logical data model. In the realm of fact and dimension tables, a data model is essential for illustrating how these tables work together to support comprehensive analysis and business intelligence.
In a data warehouse, the data model serves as the backbone, ensuring that data is organized in a way that facilitates efficient querying and reporting. Fact and dimension tables play a crucial role in this structure. Fact tables store quantitative data, such as sales figures or transaction counts, while dimension tables provide descriptive attributes that give context to the data, such as dates, product categories, or customer demographics. Together, these tables enable businesses to perform detailed analysis and gain valuable insights from their data.
Exploring the data model description leads us to recognize the importance of well-defined structures. For instance, to define a data model, one must consider business requirements, technical constraints, and user needs. Questions like “what are data models” or “what is data modelling” emphasize the significance of creating systems that improve data usability. From hierarchical designs to relational databases, the ability to model and manage data effectively remains a cornerstone of successful data-driven operations.
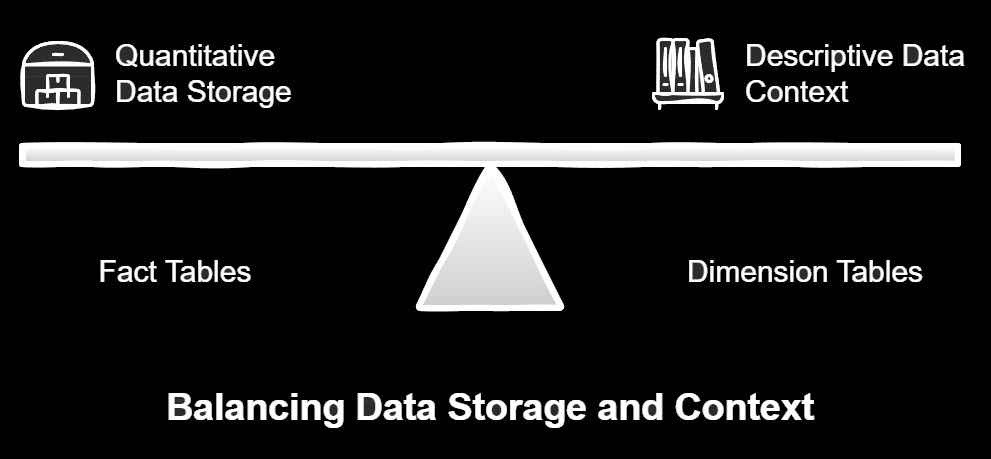
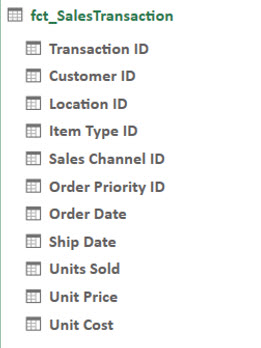
Fact tables are the workhorses of a data warehouse, storing the quantitative data that drives business analysis. The level of detail, or data granularity, in fact tables is crucial for accurate and meaningful analysis.
Here are some key characteristics of fact tables:
Quantitative Data: Fact tables hold numerical data that can be aggregated and analyzed, such as sales amounts, revenue, or customer counts.
High Volume: These tables typically contain a large volume of data, reflecting the detailed transactions or events recorded over time.
Business Intelligence: Fact tables are integral to business intelligence and data analysis, providing the raw data needed for reporting and decision-making.
Denormalization: To improve query performance, fact tables are often denormalized, meaning they may contain redundant data. This trade-off helps speed up data retrieval.
Contextual Analysis: Fact tables are used in conjunction with dimension tables, which provide the context needed to interpret the quantitative data. For example, a sales fact table might be linked to dimension tables for products, time periods, and regions.
By understanding these characteristics, you can better appreciate the role of fact tables in a data warehouse and how they support comprehensive analysis.
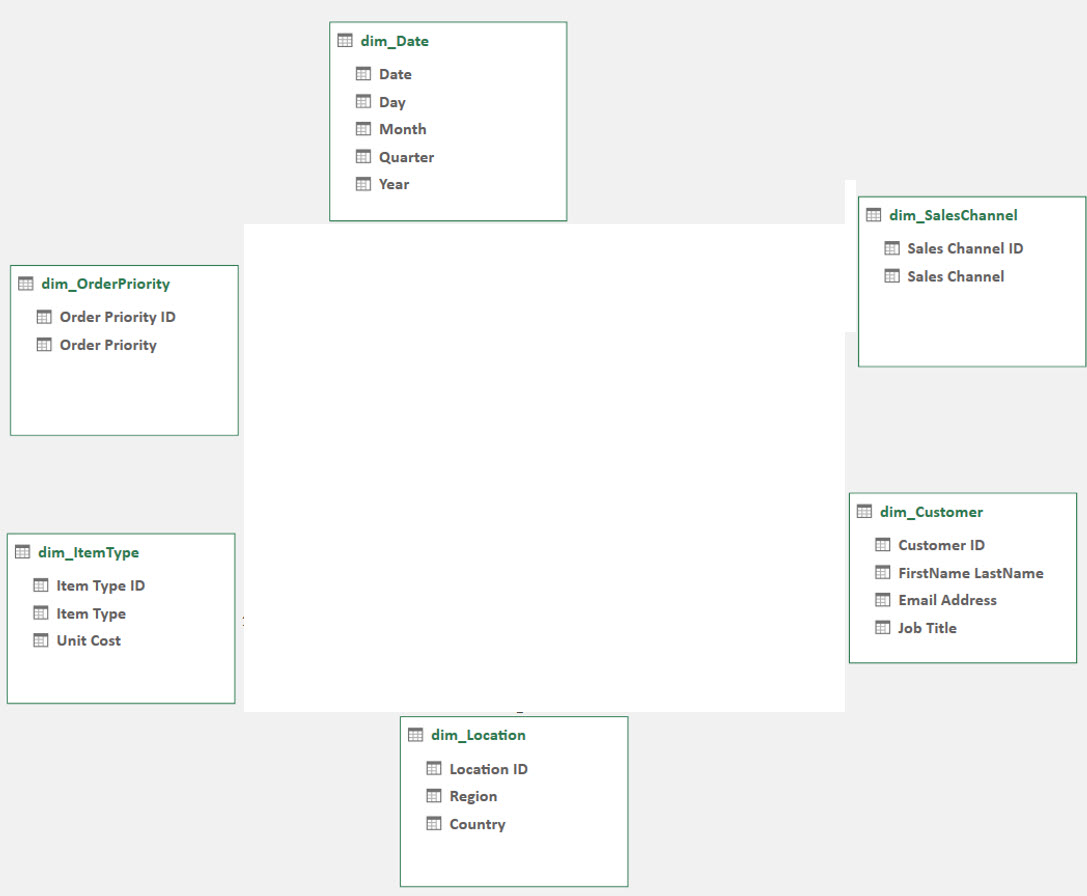
Dimension tables are key to understanding data in a warehouse, providing context to the numbers in fact tables. They store descriptive information like customer names, product details, or dates, making it easier to filter, group, and analyze data.
While fact tables focus on the numbers, like sales totals, dimension tables add meaning by linking those numbers to attributes like what was sold, who bought it, and when it happened. Together, they enable detailed reporting and deeper insights.
Here are some key characteristics of dimension tables:
Descriptive Attributes: Contains textual or descriptive information, such as product names, regions, or dates. These attributes help categorize and filter the data in the fact table.
Primary Key: Each dimension table has a primary key column, which uniquely identifies each row. This primary key connects to the foreign key in the fact table, establishing relationships.
Granularity: Dimension tables are usually at the lowest level of granularity required for analysis. For example, a “Product” dimension table will have rows for each product.
Smaller in Size: Compared to fact tables, dimension tables are smaller and contain fewer rows since they represent descriptive data, not transactional details.
Hierarchies: Often include hierarchies (e.g., Year > Quarter > Month > Day) that enable drill-down analysis in reporting tools.
The Data Model allows Excel to bring data from multiple sources together and use relationships to simplify analysis, facilitating seamless data integration. It lets you:
Combine tables into one dataset.
Build relationships between tables for reporting.
Use fact and dimension tables to model data.
Data warehouses play a crucial role in organizing and managing large datasets, and Excel’s Data Model can be used to structure data in a way that enhances query performance and overall effectiveness.
Excel Data Model Features:
Dynamic: Updates automatically when new data is added.
Customizable: Allows you to modify calculations and add helper tables.
Scalable: Handles large datasets with Power Pivot.
Data Model Components
1. Fact and Dimension Tables
A Data Model consists of fact tables and dimension tables:
Fact Table: Holds measurable data like sales or revenue. Fact tables often hold primary keys of the dimension tables, which are essential for associating quantitative metrics with descriptive information.
Dimension Table: Holds descriptive data like dates, product categories or regions. Foreign keys are used to establish relationships between fact tables and dimension tables, facilitating comprehensive data analysis.
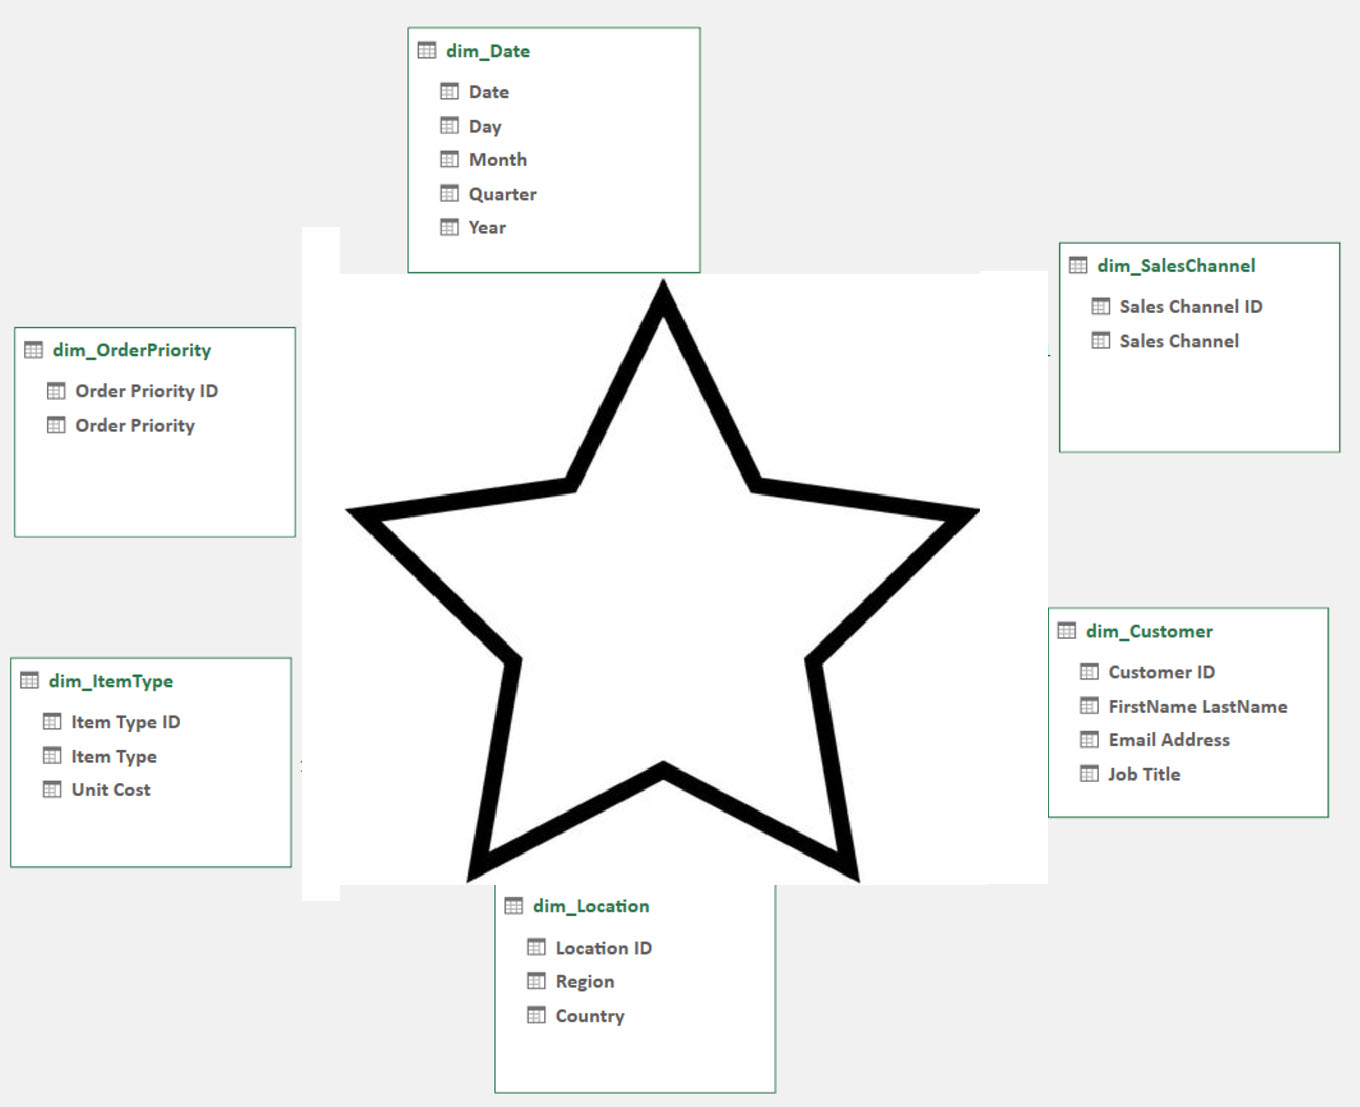
For example in a Star Schema the fact table is in the middle and the dimension tables surround it in a star shape. This schema is good for performance, simplicity of calculations, and ensuring data consistency.
2. Build Relationships
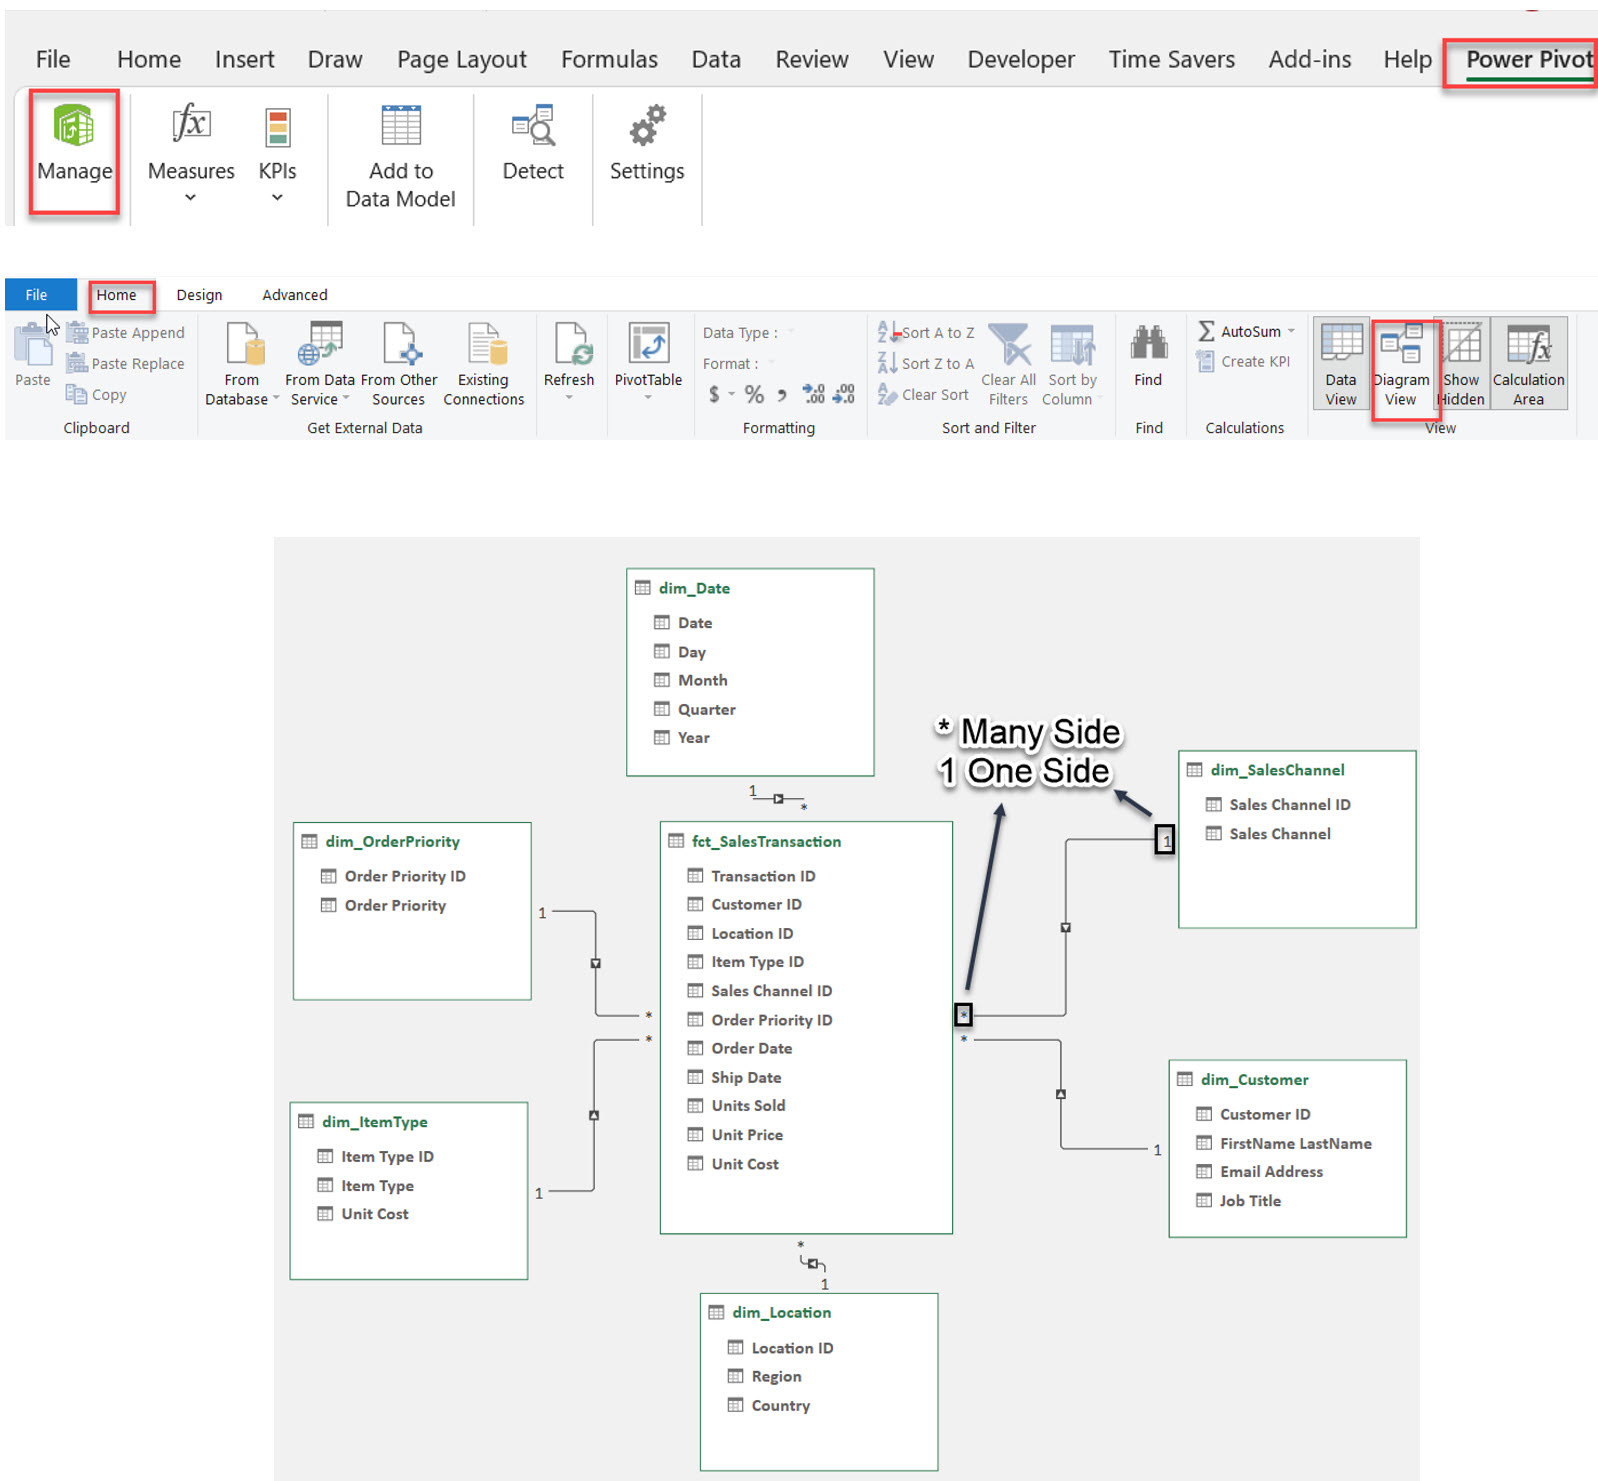
Relationships are the heart of any Data Model. Data mapping is essential for accurately linking fields from dimension tables to fact tables. They connect fields from dimension tables (one side) to fact tables (many sides).
Role playing dimensions allow a single dimension to serve multiple, distinct roles within a table structure, providing greater flexibility and clarity in data representation.
Steps to Build Relationships:
Go to Power Pivot → Manage → Home → Diagram View.
Arrange the tables in a star shape, link dimension tables to the fact table.
Table names should start with dim (dimension table) and fct (fact table) for simplicity.
Tip: Relationships help DAX (Data Analysis Expressions) to retrieve data faster, calculations will be quicker.
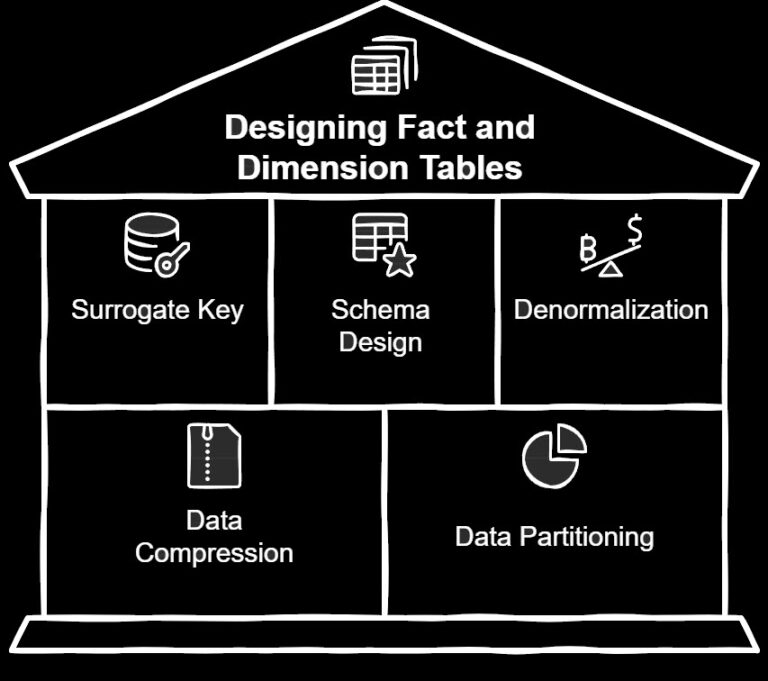
Designing fact and dimension tables is a critical step in building an effective data warehouse. Proper data governance ensures that your data is organized for optimal performance and accuracy. Proper design ensures that your data is organized for optimal performance and accuracy. Here are some best practices to consider:
Surrogate Key: Use a surrogate key as the primary key for your fact table. Surrogate keys are unique identifiers that improve query performance and maintain data integrity, especially when dealing with large datasets.
Schema Design: Organize your fact table and related dimension tables using a star schema or snowflake schema. The star schema, with its central fact table and surrounding dimension tables, is particularly effective for simplifying queries and enhancing performance.
Denormalization: While denormalization can improve query performance by reducing the need for complex joins, it’s important to balance this with the need to maintain data integrity. Carefully consider which data to duplicate.
Data Compression: Implement data compression techniques to reduce storage requirements and improve query performance. This is especially useful for large fact tables with extensive historical data.
Data Partitioning: Use data partitioning to divide your fact table into smaller, more manageable segments. This can significantly enhance query performance and reduce storage costs by allowing more efficient data retrieval and management.
By following these best practices, you can design fact and dimension tables that not only support efficient data analysis but also ensure the integrity and performance of your data warehouse. Additionally, maintaining data lineage helps track the origins and transformations of data within the warehouse.
Star schema are is a common data warehouse design patterns that use dimension tables to provide context to fact tables. Thos schemas organize data in a way that supports efficient querying and reporting, making them popular choices for data warehouse design.
A star schema consists of a central fact table surrounded by dimension tables, forming a star-like pattern. This design is particularly effective for simplifying queries and enhancing performance, as the denormalized dimension tables reduce the need for complex joins. In a star schema, each dimension table is directly linked to the fact table, providing a straightforward and intuitive structure for data analysis.
Creating a Data Model in Excel involves importing data, organizing it, and performing data transformation to build relationships.
Data engineering is crucial for establishing effective data storage structures, particularly through the use of schemas like the star schema.
Steps:
Import your data into Excel from multiple sources.
Go to Power Pivot → Add to Data Model.
Build relationships in Diagram View by linking fields between tables.
Use helper columns or tables for extra calculations.
Use DAX formulas for measures and KPIs.
To add rows to an existing Data Model:
Update the source table in Excel with the new data.
Go to Power Pivot → Refresh.
The new rows will be added to the model.
If you want to extract data from the Data Model:
Create a PivotTable from the Data Model.
Copy the PivotTable data and paste as values into a new sheet.
Or use Power Query to extract and load the data back as a table.
Use Power Pivot’s Diagram View to see table relationships and arrange tables in a star shape.
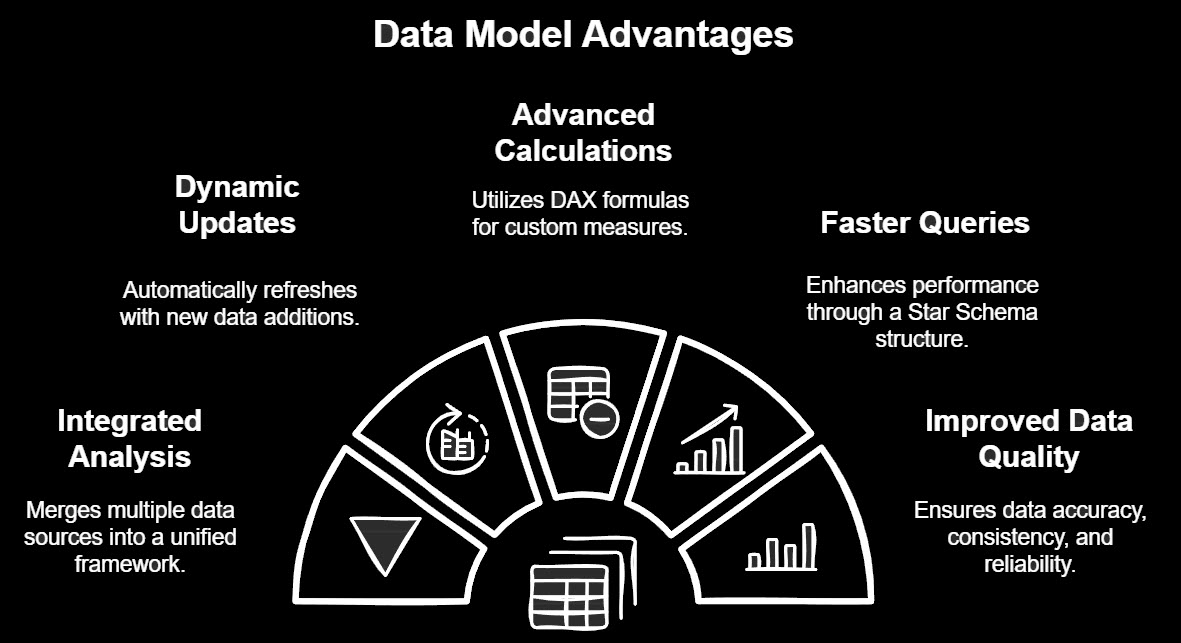
Integrated Analysis: Merge multiple data sources into one framework.
Dynamic Updates: Will refresh automatically when new data is added.
Advanced Calculations: Use DAX formulas for custom measures.
Faster Queries: Star Schema structure will improve performance.
Improved Data Quality: Ensures that data is accurate, consistent, and reliable for analysis.
The Data Model in Excel is a must have to merge, manage and analyze data. With fact and dimension tables, relationships and DAX formulas it’s a powerful tool for big data. Whether you create a star schema or manage relationships, with Excel Data Model and Power Pivot you’ll simplify your data analysis. Learn data modeling in Excel and unleash your data for reporting and visualization.

92% of students automate workflows, build CEO-ready dashboards, and streamline collaboration in < 1 hour. Don’t miss out!
🎯Master every Office 365 tool like Excel, Word, PowerPoint, Teams, Outlook and OneNote.
🎯Streamlined approach—no fluff, just rapid skill-building.
🎯Eliminate tedious tasks with intelligent automation.
🎯Transform everyday workflows into strategic power moves.
🎯Boost productivity and impress every boss.
🎯Real-World Projects – directly translate lessons into workplace wins.