Get the ultimate guide to Microsoft Excel charts and dashboards. Learn how to create interactive dashboards, 16 chart types, templates, and integrate Power BI for data visualization.
by Mihir Kamdar / Last Updated:
In this guide you’ll learn:
16 Excel chart types, their uses and examples.
How to create interactive dashboards and interactive charts in Excel step by step.
How to create charts that look good and work well.
Advanced features like dynamic updates, custom templates and real-time data connections.
How to fix common chart and dashboard issues.
Download our step-by-step tutorial file now by clicking on the icon below and follow along to enhance your Excel skills practically and efficiently!
In this data age, visualization is a must-have skill. Whether you’re tracking sales, analyzing market trends or presenting to executives, Excel charts and dashboards make data actionable and visible.
Excel dashboards and charts turn raw data into visual magic, providing a visual representation so you can see patterns, track KPIs and make decisions with confidence. By learning these skills, including data visualization, you’ll level up your toolset and turn numbers into stories.
n Excel dashboard is a visual representation of data that consolidates and displays key metrics, key performance indicators (KPIs), and data summaries from various sources. It provides a compact and easy-to-understand overview of critical business data, allowing users to quickly extract insights and make informed decisions. Excel dashboards can contain raw numbers, tables, charts, and other visual elements that enrich the information conveyed.
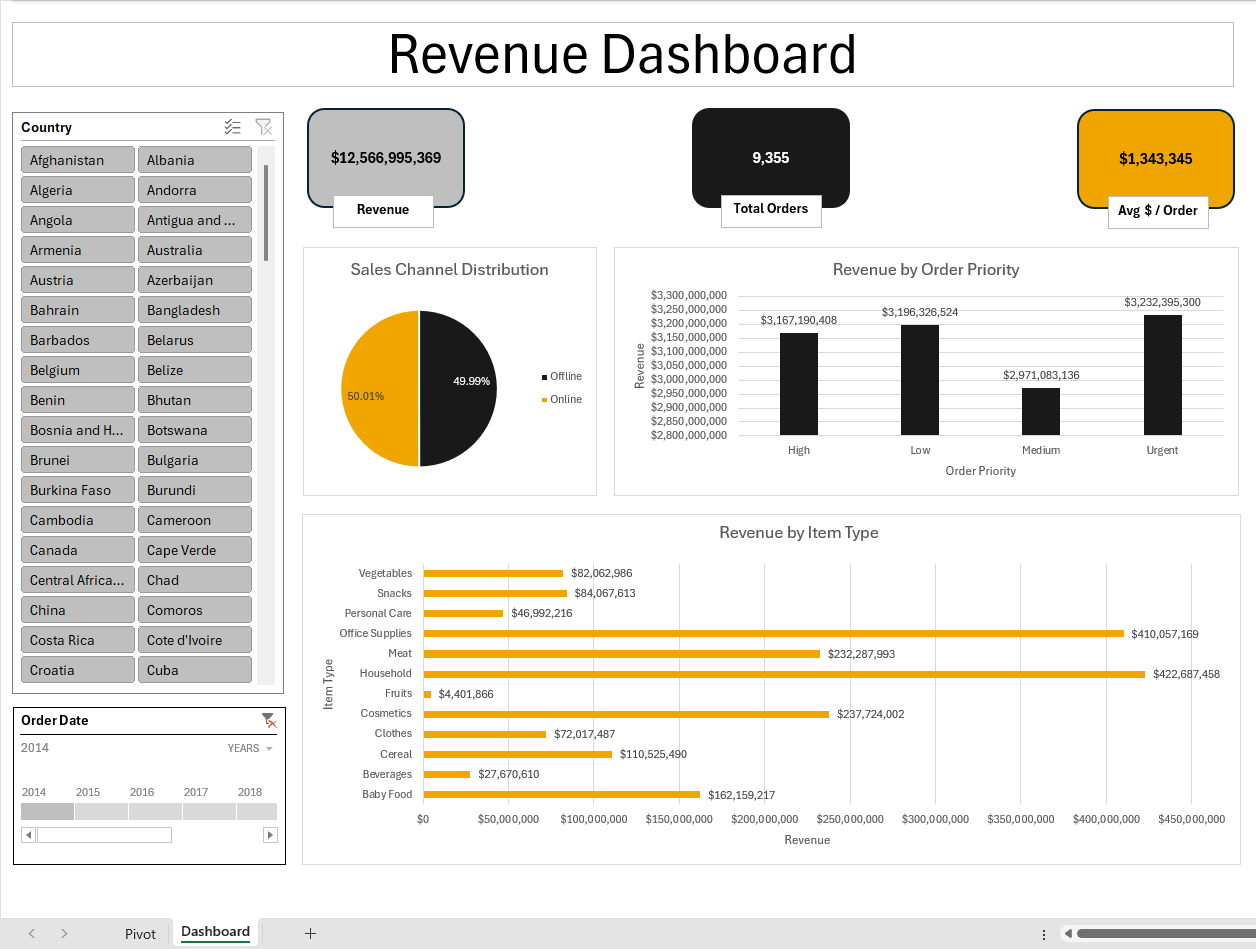
Before building an Excel dashboard, it’s essential to lay the groundwork for dashboard design and data analysis. This includes understanding the requirements and goals of the dashboard, identifying the target audience, determining the data needed, and deciding on the layout and distribution of the dashboard.
Purpose and Audience
The purpose of the dashboard should be clear, and the goals and objectives should be identified before building it. The dashboard should answer a specific business question or solve a particular problem. The target audience should also be identified, including their goals and needs when interacting with the dashboard. This will help determine the level of detail and complexity required in the dashboard. Incorporating business intelligence principles can further enhance the effectiveness of your dashboard.
Data and Layout
The data needed for the dashboard should be determined, including the amount of data required, the data sources, and how often it needs to be updated. The layout of the dashboard should be designed to effectively communicate the data insights, using visual elements such as charts, tables, and conditional formatting. The layout should be simple, concise, and easy to navigate.

Try communicating a trend or performance metric with just rows of numbers. It’s boring, time-consuming and often doesn’t work. That’s where Excel charts and dashboards come in. They represent data and turn complex data into visual stories, enhancing data storytelling.
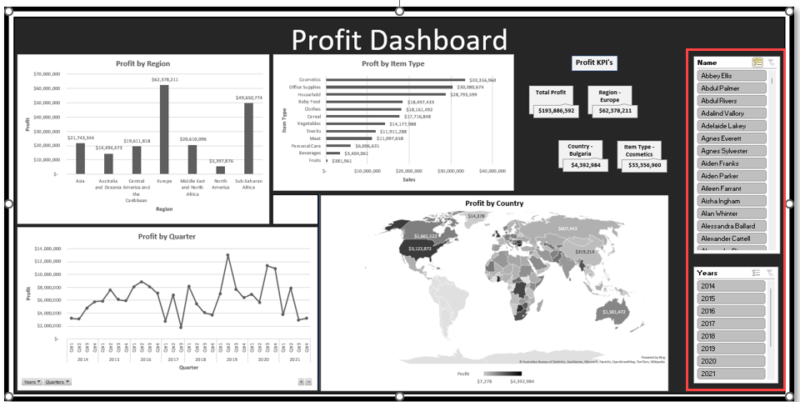
Clarity and Accuracy: See data trends, comparisons and insights in an instant.
Professional Reporting: Wow stakeholders with interactive dashboards.
Better Decision Making: Spot patterns, opportunities, and bottlenecks faster, leading to data-driven decisions.
Automation: Use dynamic updates to keep dashboards up to date without manual intervention.
Customization: Use an Excel workbook and dashboard templates to tailor dashboards to your business needs.
Integration: Insert Power BI dashboards into Excel.
Excel has 16 chart types, each for a specific data visualization technique. Let’s dive in.
You can access these chart types through the Charts tab in Excel.
1. Column Chart
Column charts show vertical bars and are great for comparing data across categories or over time.
When to Use:
Monthly sales figures.
Product revenue by year.

2. Bar Chart
Bar charts are like column charts but horizontal, so great for longer labels or categories.
When to Use:
Customer satisfaction ratings.
Survey results across demographic groups.

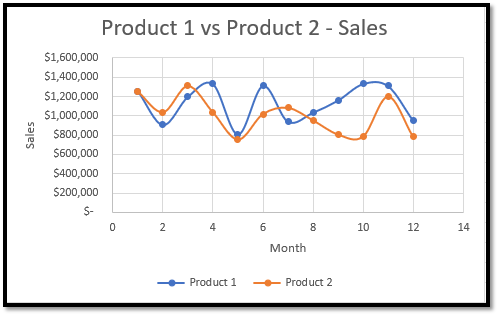
3. Line Chart
Line charts are great for showing trends over time.
When to Use:
Website traffic over months.
Stock price movements.

4. Pie and Doughnut Charts
Pie charts and doughnut charts are for showing parts of a whole. A pie chart is a graphical representation of data that shows the size of items in one data series as a proportion of the total, effectively visualizing how different elements compare to each other. They work well when comparing percentages or proportions, especially in scenarios with limited categories and when emphasizing relationships within a single data series.
When to Use:
Budget allocations.
Product market share.

5. XY Scatter Plot
Scatter plots are good for analyzing two variables.
When to Use:
Marketing spend vs sales revenue.
Customer satisfaction vs churn rates.
6. Area Chart
Area charts fill the space below a line chart to emphasize magnitude.
When to Use:
Cumulative sales.
Growth across multiple categories.

7. Radar Chart
Radar (or spider) charts, also known as radar charts, are for comparing multiple variables in a circular grid.
When to Use:
Employee performance across skills.
Features of competing products.

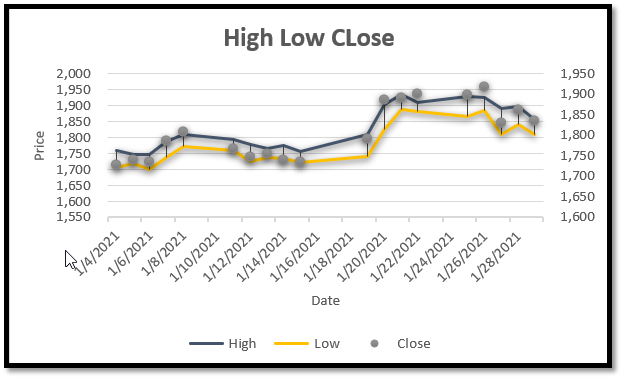
8. Stock Chart
Stock charts show high, low, open and close prices. Great for financial analysis.
Stock market performance.
Commodity price trends.
9. Histogram Chart
Histograms show data frequency to understand distributions.
When to Use:
Test score ranges.
Customer purchase behavior.

10. Pareto Chart
Pareto charts combine bars and cumulative line graphs to show the 80/20 rule.
When to Use:
Top selling products.
Quality improvement areas.

11. Waterfall Chart
Waterfall charts show how each step contributes to the final value.
When to Use:
Cash flow changes.
Revenue growth components.

12. Box & Whisker Chart
Box and whisker charts are good for statistical analysis, showing data distribution, median and outliers.
When to Use:
Survey data variability.
Exam scores across groups.

13. Treemap Chart
Treemaps are for hierarchical data in nested rectangles.
When to Use:
Sales by product category and sub-category.
Market share across segments.

14. Map Chart
Map charts show data geographically to see regional trends.
When to Use:
Sales by country.
Demographic data.

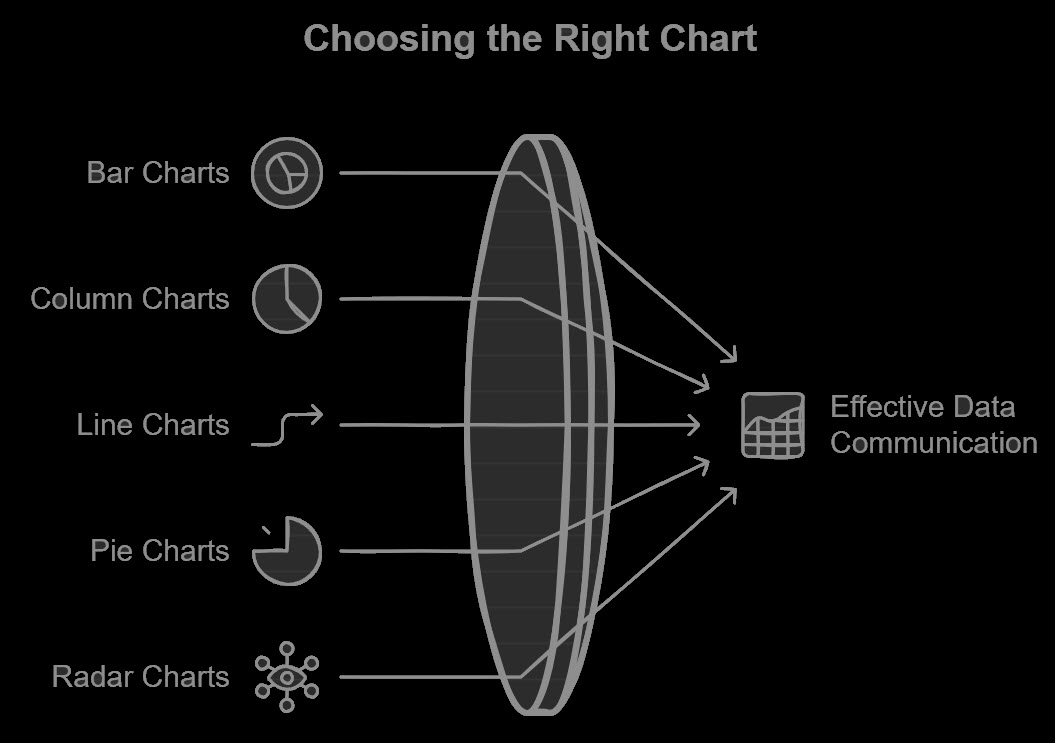
Choosing the right chart for your Excel dashboard is crucial to effectively communicate your data insights. With so many chart types available, it can be overwhelming to decide which one to use. Here are some tips to help you choose the right chart:
Bar Charts: Use bar charts to compare categorical data across different groups. They are ideal for showing the relationship between two variables. For example, you can use a bar chart to compare customer satisfaction ratings across different regions.
Column Charts: Use column charts to show trends over time or to compare data across different categories. They are similar to bar charts but are often used to show data that has a clear beginning and end. For instance, a column chart can effectively display monthly sales figures.
Line Charts: Use line charts to show trends over time or to illustrate the relationship between two continuous variables. They are ideal for showing data that has a clear progression or pattern, such as website traffic over several months.
Pie Charts: Use pie charts to show how different data elements proportionally compare to one another. They are ideal for showing data that has a clear beginning and end, like budget allocations or product market share.
Radar Charts: Use radar charts to compare multiple data points across different categories. They are ideal for showing data that has multiple variables, such as employee performance across various skills.
When choosing a chart, consider the following factors:
Data Type: What type of data are you working with? Categorical, numerical, or a combination of both?
Data Distribution: How is your data distributed? Is it skewed, normal, or bimodal?
Comparison: Are you comparing data across different groups or showing trends over time?
Insight: What insight do you want to communicate with your chart?
By considering these factors, you can choose the right chart to effectively communicate your data insights and create a compelling Excel dashboard.
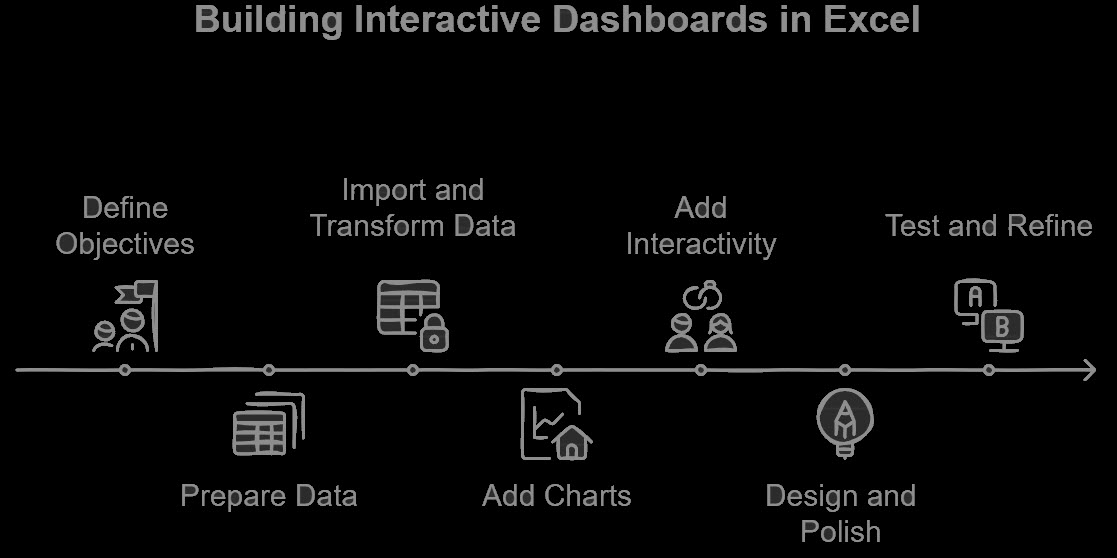
An Excel dashboard is a single page that combines multiple charts and data points using data visualization tools. It allows data exploration, real-time updates and sharing of insights. Here’s how:
Step 1: Objectives
Before you build your dashboard, define what metrics and questions it will answer:
What KPIs will your audience care about?
What should the dashboard show?
Incorporating business intelligence principles can help in defining clear objectives for your dashboard.
Step 2: Prepare Your Data
Clean Your Dataset: Remove duplicates, errors and irrelevant fields.
Structure Data: Put chart data into tables for easier analysis and ensure all data sources are properly integrated.
Use Excel Dashboard Templates: Use pre-built templates to speed up the setup.
Step 3: Import and Transform Data
To create an Excel dashboard, data first needs to be imported into an Excel workbook. This can be done by copying and pasting data from a CSV file or by using the “Import Data” feature in Excel. Once the data is imported, it should be transformed and prepared for use in the dashboard. This includes cleaning the data, removing duplicates, and formatting the data for use in charts and tables. Excel formulas and functions can be used to build calculations needed for the dashboard, enhancing data analysis.
Step 4: Add Charts
Use one of the 16 above to create interactive charts for your dashboard:
Use line charts for trends.
Add pie charts for proportions.
Use bar charts for category comparisons.
Use Gantt charts for project timelines.
To represent your information effectively, select data to create the most appropriate chart type.
Step 5: Add Interactivity
Use Excel features to add interactivity and facilitate data-driven decisions:
Slicers: Filter data fast.
Timelines: Drill into time-based data.
Drop-down Menus: Switch between categories.
Step 6: Design and Polish
Consistent Color Schemes and Fonts: Same look throughout the dashboard.
No Clutter: Remove gridlines and labels to keep it clean.
Group Related Metrics: Use a meaningful chart title to keep it logical and enhance data storytelling.
Make your Excel dashboards look modern: Use modern design and minimalism.
Step 7: Test and Refine
Share with stakeholders and get feedback to make sure it’s intuitive and answers their questions. Make changes based on the feedback.
Incorporating business intelligence feedback can further refine the dashboard.
Effective dashboard design is critical to creating a dashboard that is useful and engaging. Here are some principles to keep in mind:
Keep it simple and concise: Avoid clutter and focus on the most important information.
Use clear and consistent formatting: Use a consistent color scheme, font, and layout throughout the dashboard.
Use visual elements to convey information and enhance data storytelling: Use charts, tables, and other visual elements to communicate insights and trends.
Make it interactive and engaging: Use interactive elements, such as filters and drill-downs, to make the dashboard more engaging and useful.

Once you’ve created a basic dashboard, you can use advanced techniques to make it more powerful and effective. Here are some advanced dashboard techniques:
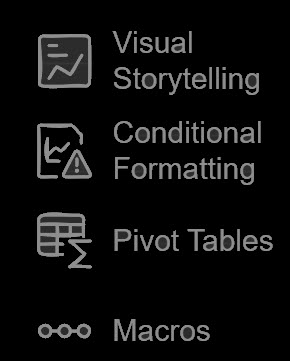
Use multiple visuals to tell a story: Combine multiple charts and tables to tell a story and communicate insights.
Use conditional formatting: Use conditional formatting to highlight important information and trends.
Use pivot tables: Use pivot tables to summarize and analyze large datasets, enhancing data analysis.
Use macros: Use macros to automate tasks and make the dashboard more interactive.
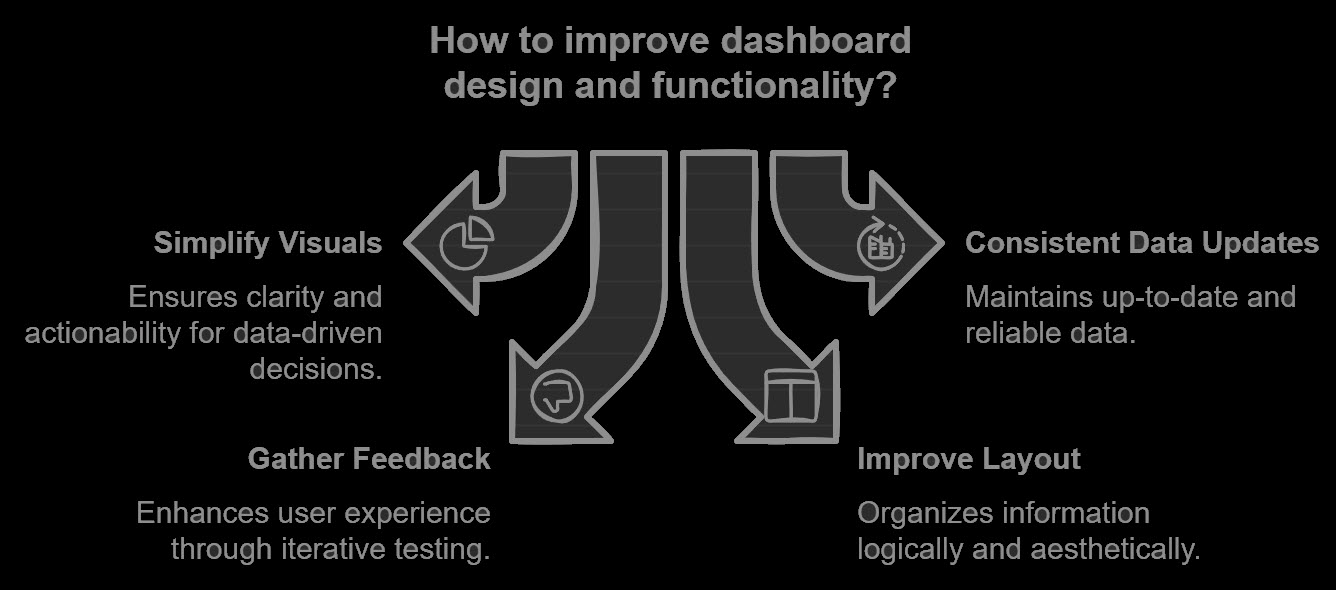
Overcomplicating Visuals: Keep it simple and actionable to facilitate data-driven decisions.
Inconsistent Data Updates: Use Power Query for auto refresh.
Not getting feedback: Test with users and iterate.
Bad layout and design: Customize each chart element to keep it logical and organized.
Excel charts and dashboards are a superpower for anyone who works with data. By using the 16 chart types and combining them into dashboards, you can turn numbers into insights that drive decisions. Whether you’re a beginner or advanced, follow these steps and best practices to level up your data visualization skills.

92% of students automate workflows, build CEO-ready dashboards, and streamline collaboration in < 1 hour. Don’t miss out!
🎯Master every Office 365 tool like Excel, Word, PowerPoint, Teams, Outlook and OneNote.
🎯Streamlined approach—no fluff, just rapid skill-building.
🎯Eliminate tedious tasks with intelligent automation.
🎯Transform everyday workflows into strategic power moves.
🎯Boost productivity and impress every boss.
🎯Real-World Projects – directly translate lessons into workplace wins.